 Visual Paradigm Desktop |
  Visual Paradigm Online


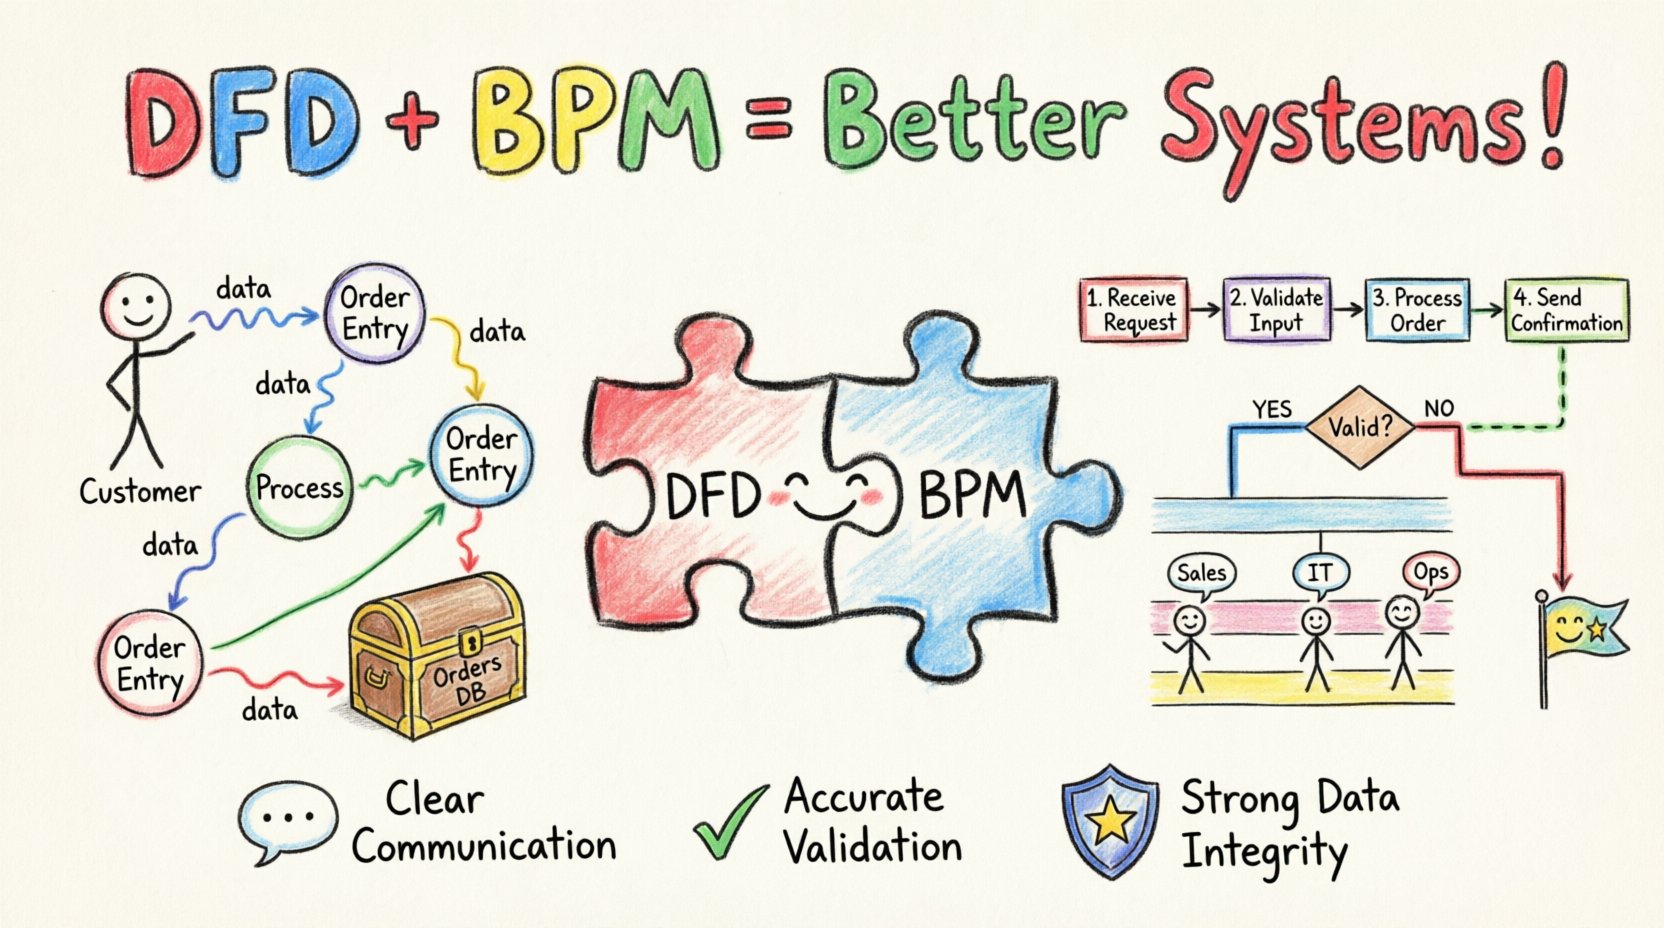
In the complex landscape of system analysis, clarity is currency. Analysts often face the challenge of capturing how a business operates and how data moves through that operation simultaneously. Too often, these two aspects are treated as separate silos. However, the most robust system designs emerge when we combine the flow of data with the flow of work. This guide explores how Data Flow Diagrams (DFD) and Business Process Mapping (BPM) work together to create a comprehensive view of information systems.
By integrating these two modeling techniques, organizations can achieve a deeper understanding of their operational reality. This alignment reduces ambiguity, improves stakeholder communication, and ensures that technical solutions support actual business needs. Let us delve into the mechanics of this pairing and how it strengthens the analysis phase.
A Data Flow Diagram is a graphical representation of the flow of data through an information system. Unlike structural diagrams that show how components are connected, a DFD focuses on what happens to the data. It answers the question: Where does the data come from, how is it transformed, where does it go, and where is it stored?
The DFD is a foundational tool in structured analysis. It breaks down complex systems into manageable levels of detail. This hierarchical approach allows analysts to zoom in on specific areas without losing sight of the broader context.
Every valid DFD relies on four fundamental elements. Understanding these is crucial for accurate modeling.
To manage complexity, DFDs are typically created at three distinct levels:
While DFDs focus on data, Business Process Mapping focuses on activity and workflow. BPM visualizes the sequence of steps taken to achieve a specific business outcome. It captures the who, what, when, and where of operations.
Process maps are essential for understanding the human and organizational side of system requirements. They reveal bottlenecks, redundancies, and decision points that data alone might miss.
Unlike DFDs, which are abstract, process maps often reflect the current reality of the organization. This makes them powerful tools for identifying inefficiencies before a new system is built.
When used in isolation, both DFDs and BPMs offer a partial view. DFDs show the data structure but lack the context of human decision-making. BPMs show the workflow but may obscure how data is stored or transformed technically. Combining them creates a holistic model.
| Feature | Data Flow Diagram (DFD) | Business Process Mapping (BPM) |
|---|---|---|
| Primary Focus | Information movement and transformation | Activity sequence and workflow |
| Key Question | Where does the data go? | Who does the work and when? |
| Representation | Processes, Data Stores, Flows | Steps, Decisions, Roles |
| System Boundary | Clear distinction between system and external | Focuses on the entire business scope |
| Best Used For | Database design and data architecture | Operational efficiency and role definition |
By layering these models, analysts can ensure that every business step has a corresponding data requirement, and every data movement has a business justification.
Integration is not about merging the diagrams into one image. It is about aligning the logic of both so they reference each other consistently. This ensures that the system design reflects both the data needs and the operational reality.
When an analyst creates a process map, they should identify the data inputs and outputs for each step. These data points become the flows in the DFD. Conversely, when a DFD is designed, the processes involved should be mapped to specific business activities to ensure they serve a purpose.
This alignment prevents a common pitfall: building a system that moves data efficiently but does not support the actual work people need to do. It also prevents the reverse: creating a workflow that looks logical on paper but lacks the data structure to support it technically.
To integrate effectively, follow this mapping logic:
Implementing this dual-model approach requires a structured workflow. Below is a practical sequence for analysts to follow during the requirements phase.
Even with a solid strategy, analysts can encounter obstacles. Recognizing these common issues early can save significant time during the design phase.
Attempting to show every detail in a single diagram leads to confusion. Keep the DFD and BPM at appropriate levels of abstraction. Use annotations to link to more detailed documents if necessary.
Both models often focus on the “Happy Path”—what happens when everything goes right. However, a robust system must handle errors. Ensure the process map includes exception flows and the DFD accounts for error data logs.
In process maps, roles are often listed but not integrated into the data model. Ensure that the DFD acknowledges who owns specific data stores or processes. This clarifies security and access control requirements.
Business processes change. Data flows evolve. Treat these models as living documents. Establish a version control process to track changes in both the data and the workflow over time.
One of the greatest benefits of pairing DFD and BPM is improved communication with non-technical stakeholders. Executives and end-users often struggle with pure data models. They understand workflows and activities better.
When an analyst shows a process map, users can nod and say, “Yes, we do this.” When the analyst then overlays the data requirements, users can clarify what information they need to input or receive. This shared visual language reduces misinterpretation and builds trust.
Furthermore, this pairing helps in requirements validation. If a business requirement exists in the process map but has no corresponding data flow, it may be a phantom requirement. If a data flow exists but has no business process supporting it, it may be unnecessary complexity.
How do you know if your combined modeling effort was successful? Look for these indicators during the development and testing phases.
As technology evolves, the way we model systems also changes. Automation and artificial intelligence are beginning to influence how we capture requirements.
Modern tools allow for the automatic generation of data models from process flows. While this speeds up the process, the human element of analysis remains critical. The decision to pair DFD and BPM ensures that automation supports human intent rather than replacing it blindly.
Additionally, the move towards agile development requires more iterative modeling. Instead of one massive document, analysts create smaller, linked models that evolve with each sprint. This approach keeps the DFD and BPM relevant throughout the project lifecycle.
System analysis is not just about drawing diagrams. It is about understanding the underlying logic of how information and work interact. By treating Data Flow Diagrams and Business Process Mapping as a natural pair, analysts can build a bridge between technical constraints and business goals.
This dual approach ensures that the resulting systems are not only functional but also usable. They support the data needs of the organization while respecting the way people actually work. In a world where digital transformation is constant, this clarity is the foundation of success.
Remember to keep your models clean, your logic consistent, and your focus on the value delivered to the business. With practice, integrating these two powerful tools becomes a natural part of the analysis workflow, leading to more robust and reliable information systems.