 Visual Paradigm Desktop |
  Visual Paradigm Online


In the early stages of building a technology company, clarity is currency. Founders often dive straight into coding without fully visualizing the underlying data movement. This approach frequently leads to technical debt and complex debugging sessions later on. A Data Flow Diagram (DFD) offers a structured method to visualize how information moves through a system. This guide explores a real-world scenario where a startup utilized this methodology to clarify their architecture before writing a single line of code.
Consider a hypothetical startup named “FlowState,” which aims to build a project management platform for remote teams. The core value proposition involves task assignment, real-time status updates, and automated reporting. The founding team faced a common problem: they had a vague understanding of how user data should travel from the interface to the database and back.
Without a clear map, the development team risked:
The solution was not more meetings, but better modeling. They adopted the Data Flow Diagram method to document the system logic. This approach allowed them to see the system as a series of transformations rather than a static database.
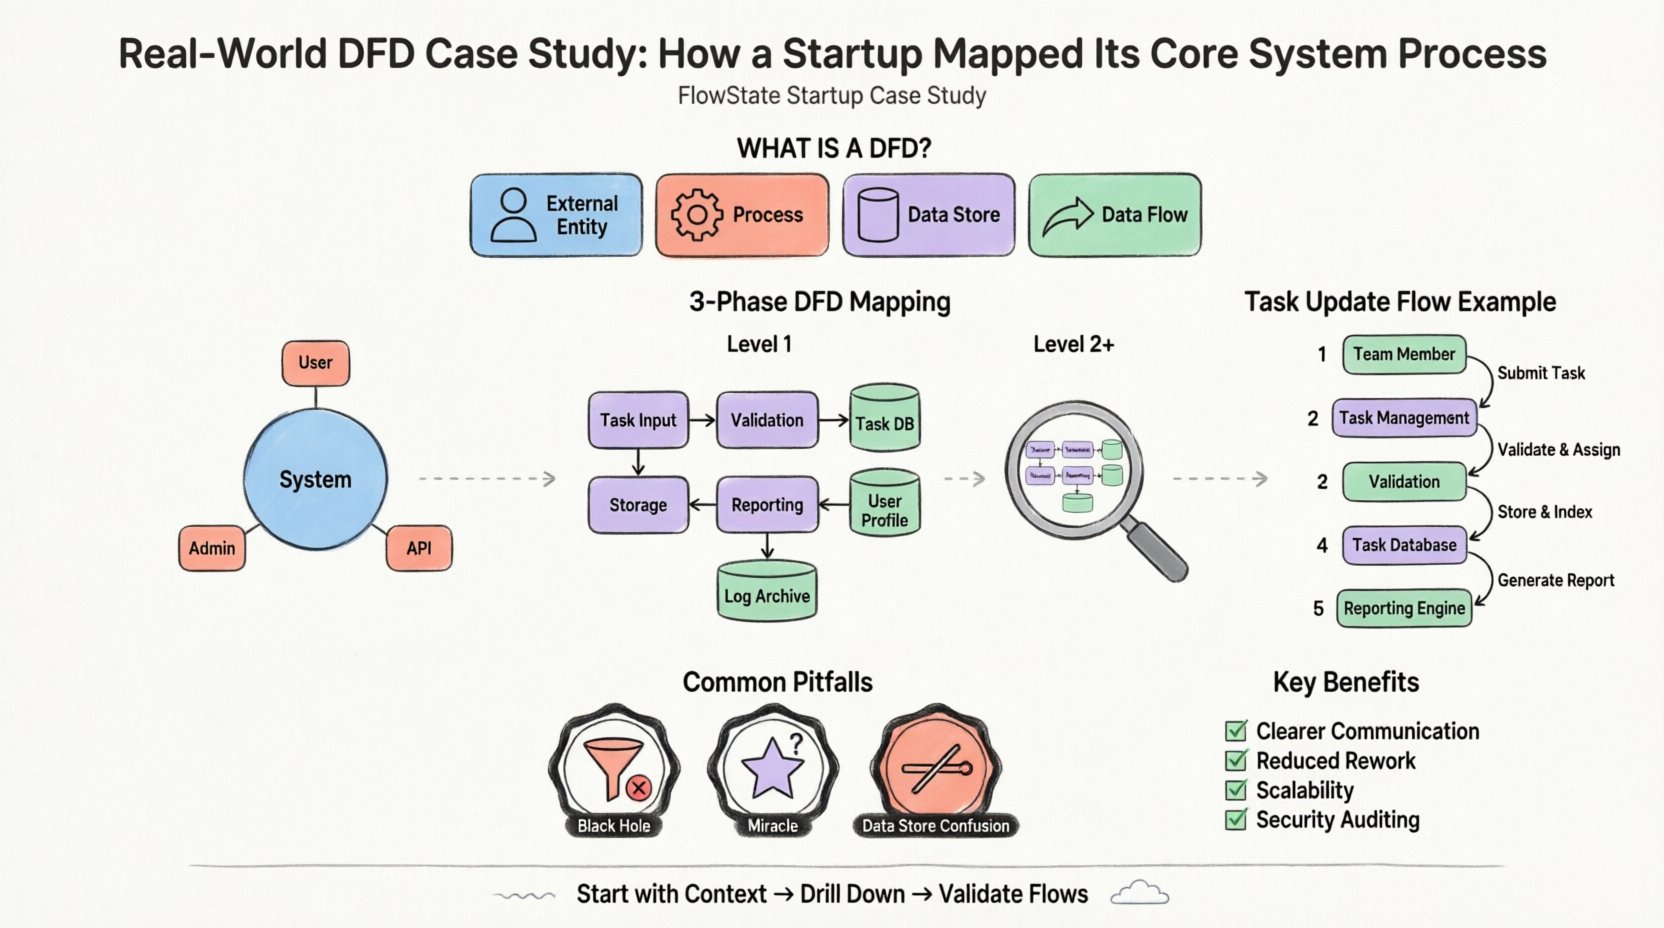
A Data Flow Diagram is a graphical representation of the flow of data through an information system. It does not show the timing of processes or the logic of decision-making (like an algorithm), but rather the movement of data from an origin to a destination. It focuses on the what, not the how.
The standard components used in this modeling technique include:
By breaking down the FlowState project into these components, the team could identify bottlenecks and ensure data integrity before implementation.
The first step in mapping the system is the Context Diagram. This is a high-level view that defines the system boundary. It shows the system as a single process and how it interacts with external entities.
For FlowState, the boundary is the project management application itself. Everything inside is part of the system; everything outside is an entity. The team identified three primary external entities:
The team drew arrows to represent the input and output streams. For example:
This single diagram clarified the scope. It prevented the team from accidentally including features like “Billing Processing” if that was not part of the core system at that time. It established a clear contract between the system and its users.
Once the high-level context was established, the team needed to understand the internal workings. This is achieved through Level 1 Decomposition. The single process from the Context Diagram is exploded into sub-processes.
The “FlowState System” was broken down into logical functional groups. The team identified the following key processes:
Crucially, the Level 1 diagram introduced data stores. This shows where information is persisted. The team identified three primary stores:
By explicitly naming these stores, the developers could immediately see which data needed to be written to the database versus held in temporary memory.
With the Level 1 structure in place, the team reviewed the specific data flowing between processes and stores. This step is often where errors are caught early.
Let’s trace the movement of a single data point: a “Task Status Change.”
This trace revealed a potential issue. The team realized that the “Reporting Engine” was being triggered manually every time a task changed. They decided to optimize this by only triggering the report process when a specific “Status = Completed” flag was set, reducing system load.
Understanding the difference between diagram levels is vital for maintaining clarity as the project grows. The table below outlines the distinctions.
| Level | Focus | Best Used For |
|---|---|---|
| Context (Level 0) | System Boundary | High-level stakeholder communication |
| Level 1 | Major Processes | Architectural planning and scope definition |
| Level 2+ | Sub-Process Detail | Specific implementation logic and debugging |
Even with a clear methodology, teams often make mistakes when creating these diagrams. The FlowState team encountered several hurdles and learned to avoid them.
A process that has input but no output is a black hole. Data enters and disappears. In the initial draft, the “Notification Handler” received data but had no arrow leaving it to the external entity. The team realized they forgot to define the actual sending mechanism. Every process must have an output.
A process that has output but no input is a miracle. It implies data is created out of thin air. The team initially had a “Generate Report” process that produced data without reading from the “Task Database.” They corrected this by adding a data flow from the store to the process.
Processes interact with data stores, but entities do not. In the beginning, the team drew a line directly from the “Team Member” to the “Task Database.” This violates the rule that data must pass through a process to be transformed or validated. All data touching a store must go through a process first.
One of the most critical rules in DFD methodology is balancing. The inputs and outputs of a parent process must match the inputs and outputs of its child diagram (the decomposition).
For FlowState, the “Task Management” process in the Level 1 diagram had specific inputs (Task Data) and outputs (Status Update). When they broke this down into Level 2 diagrams (e.g., “Create Task,” “Delete Task”), they ensured the combined flows still matched the parent. This ensures that no data is lost or created during decomposition.
Why invest time in this documentation phase? The benefits extend beyond the initial mapping.
Before moving to development, the FlowState team used the following checklist to validate their work.
The transition from a concept to a functional product requires more than just coding skills. It requires a deep understanding of the information ecosystem you are building. By mapping the data flows, FlowState ensured that their architecture was sound before deployment.
This case study highlights that a Data Flow Diagram is not just a drawing exercise. It is a critical thinking tool. It forces the team to ask difficult questions about where data comes from, where it goes, and how it changes. For any startup aiming to build a robust system, investing time in this modeling phase is a strategic advantage.
Remember, the goal is not perfection in the first draft. The goal is clarity. Start with the context, drill down to the processes, and validate the flows. This disciplined approach leads to systems that are easier to maintain, secure, and scale.
As you begin your own project mapping, keep these principles in mind. Focus on the movement of data, respect the boundaries, and validate every connection. Your future self will thank you for the clarity established today.