 Visual Paradigm Desktop |
  Visual Paradigm Online


Creating a visual representation of how information moves through a system is a fundamental skill for analysts, developers, and business stakeholders. A Data Flow Diagram, commonly known as a DFD, serves this exact purpose. It maps the flow of data between external entities, internal processes, and data stores without necessarily detailing the specific logic or timing. This guide provides a structured approach to constructing your initial DFD efficiently.
Many individuals find diagramming intimidating, fearing it requires complex tools or extensive time. However, the core principles of data flow modeling are straightforward. With a clear understanding of the symbols and a methodical approach, you can draft a functional diagram in a short timeframe. This article walks you through the essential components, the step-by-step construction process, and the validation checks needed to ensure accuracy.
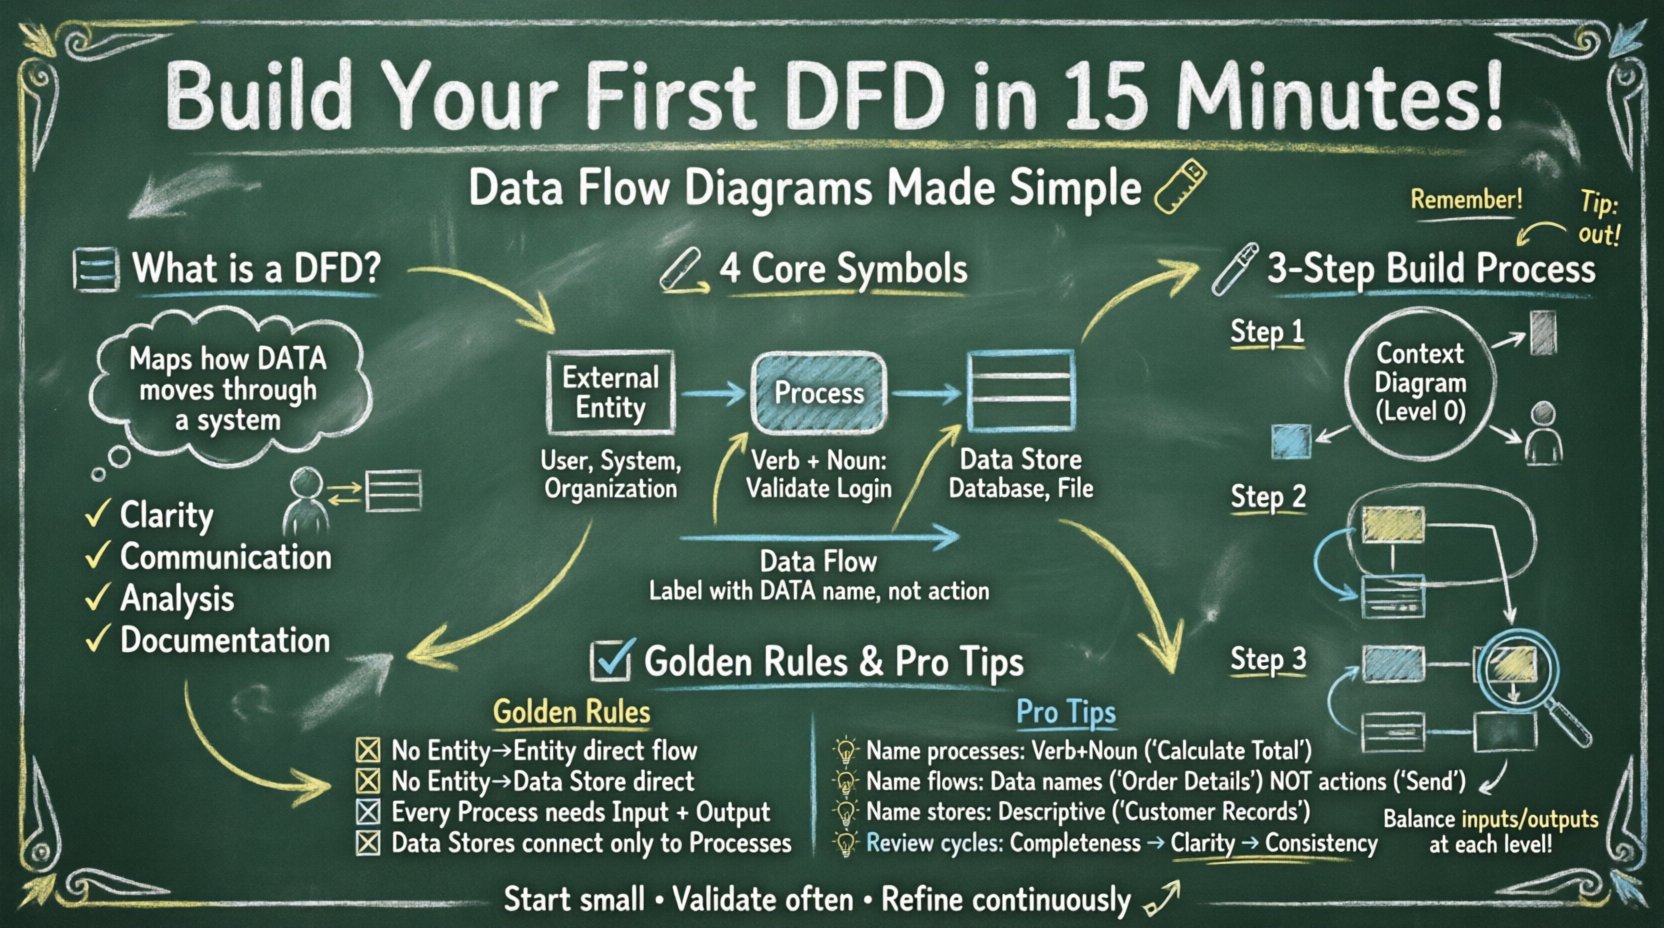
Before drawing lines and shapes, it is important to understand what a DFD represents. It is a functional model. It focuses on what the system does rather than how it does it. Unlike a flowchart, which tracks decision paths and logic sequences, a DFD tracks the movement of data packets from a source to a destination.
Key benefits of using this modeling technique include:
When you start this exercise, keep the goal in mind: to visualize the boundaries and interactions of your specific system. You do not need advanced software to begin. A whiteboard, a sheet of paper, and a pen are sufficient tools for the initial draft.
DFDs rely on a standardized set of graphical elements. While there are variations in notation (such as Yourdon/DeMarco versus Gane/Sarson), the underlying concepts remain consistent. Below is a breakdown of the four primary components you will encounter.
| Component | Shape | Description |
|---|---|---|
| External Entity | Rectangle or Square | Source or destination of data outside the system (e.g., a user, another system). |
| Process | Rounded Rectangle or Circle | Transforms input data into output data. It changes the form or content. |
| Data Store | Open Rectangle or Parallel Lines | A repository where data rests (e.g., a database, a file cabinet). |
| Data Flow | Arrow | The path data takes between components. It represents movement, not action. |
Understanding these distinctions is vital. For instance, a process must have at least one input and one output. A data store cannot simply exist in isolation; it must connect to a process to be read from or written to. External entities exist outside the system boundary, acting as the trigger or the recipient.
To build your diagram within the suggested timeframe, follow this logical sequence. This method ensures you establish the boundaries before diving into the details.
Start with a Context Diagram (often called Level 0). This is the highest-level view. It shows the system as a single process and its interaction with the outside world.
For example, in a library system, the “Borrower” is an entity. The “Issue Book” process is the system. The data flow might be “Loan Request” or “Book Details”.
Once the context is set, you must expand the single central process into sub-processes. This creates a Level 0 Diagram.
Ensure that every arrow leaving an entity in the Context Diagram still appears in the Level 0 diagram, but now it may connect to different internal processes.
This leads to the Level 1 Diagram. You select one process from Level 0 and break it down further.
A diagram is useless if its labels are ambiguous. Clear naming conventions prevent confusion during review and implementation.
Process names should follow a verb-noun structure. This clarifies the action taking place.
Avoid generic names like “Process 1” unless you are in a very early sketching phase. Specific names aid understanding.
Arrows represent data, not actions. Label them with the name of the data packet.
These should indicate the content stored.
After drafting, review the diagram against standard rules to ensure integrity. A valid DFD must adhere to specific logical constraints.
Even experienced analysts make mistakes during the initial modeling. Watch out for these common errors:
Building a DFD is rarely a one-time activity. It is an iterative process of refinement. Your first draft will likely have gaps or errors. This is normal.
Review Cycle 1: Check for completeness. Are all user requirements represented? Is every data source accounted for?
Review Cycle 2: Check for clarity. Can a new team member look at this and understand the flow without asking questions?
Review Cycle 3: Check for consistency. Do the names match across different levels of the diagram? If a data flow is called “Customer Info” in Level 0, it should be consistent in Level 1 unless it is split into specific attributes.
Do not rush to finalize the diagram. Allow time for feedback from stakeholders. Their input often reveals hidden data requirements or processes you overlooked.
As your system grows, a single page may not suffice. You may need to manage multiple diagrams. Here is how to organize them logically.
Use cross-referencing. If a process in Level 1 is expanded in Level 2, label the parent process in Level 1 with a reference code (e.g., “See Diagram 2.3”). This keeps the diagrams manageable without losing detail.
When modeling data flows, you are also implicitly modeling data security. While a standard DFD does not show encryption or authentication protocols, it does show sensitive data movement.
If a data flow contains Personally Identifiable Information (PII) or financial data, note this in the legend or labels. For example, label a flow “Encrypted Payment Data”. This reminds developers that specific security controls must be applied to that specific channel.
Once the diagram is complete and validated, it becomes a blueprint for development. It guides database design, API definition, and user interface layout. It ensures that the final product aligns with the initial requirements.
Remember that tools are secondary to understanding. Whether you use a digital whiteboard or pen and paper, the logic remains the same. The value lies in the clarity of thought you bring to the system structure.
By following the steps outlined above, you can produce a professional-grade Data Flow Diagram that serves as a reliable reference for your project team. Start small, validate often, and refine continuously. This disciplined approach leads to robust system designs.