 Visual Paradigm Desktop |
  Visual Paradigm Online


Understanding complex systems requires more than just talking about them. It requires visualizing how information moves through them. This is where the Data Flow Diagram, commonly known as a DFD, becomes an essential tool for business and systems analysts. Whether you are designing a new application, auditing an existing workflow, or documenting requirements, mastering the basics of DFDs is crucial for clear communication. This guide provides a comprehensive breakdown of what a DFD is, its core components, and how to construct one effectively.
A Data Flow Diagram is a graphical representation of the flow of data through an information system. It shows how data enters the system, how it is processed, where it is stored, and how it exits. Unlike flowcharts that focus on control flow and logic, DFDs focus strictly on data movement. This distinction is vital for analysts who need to map out system functionality without getting bogged down in decision logic.
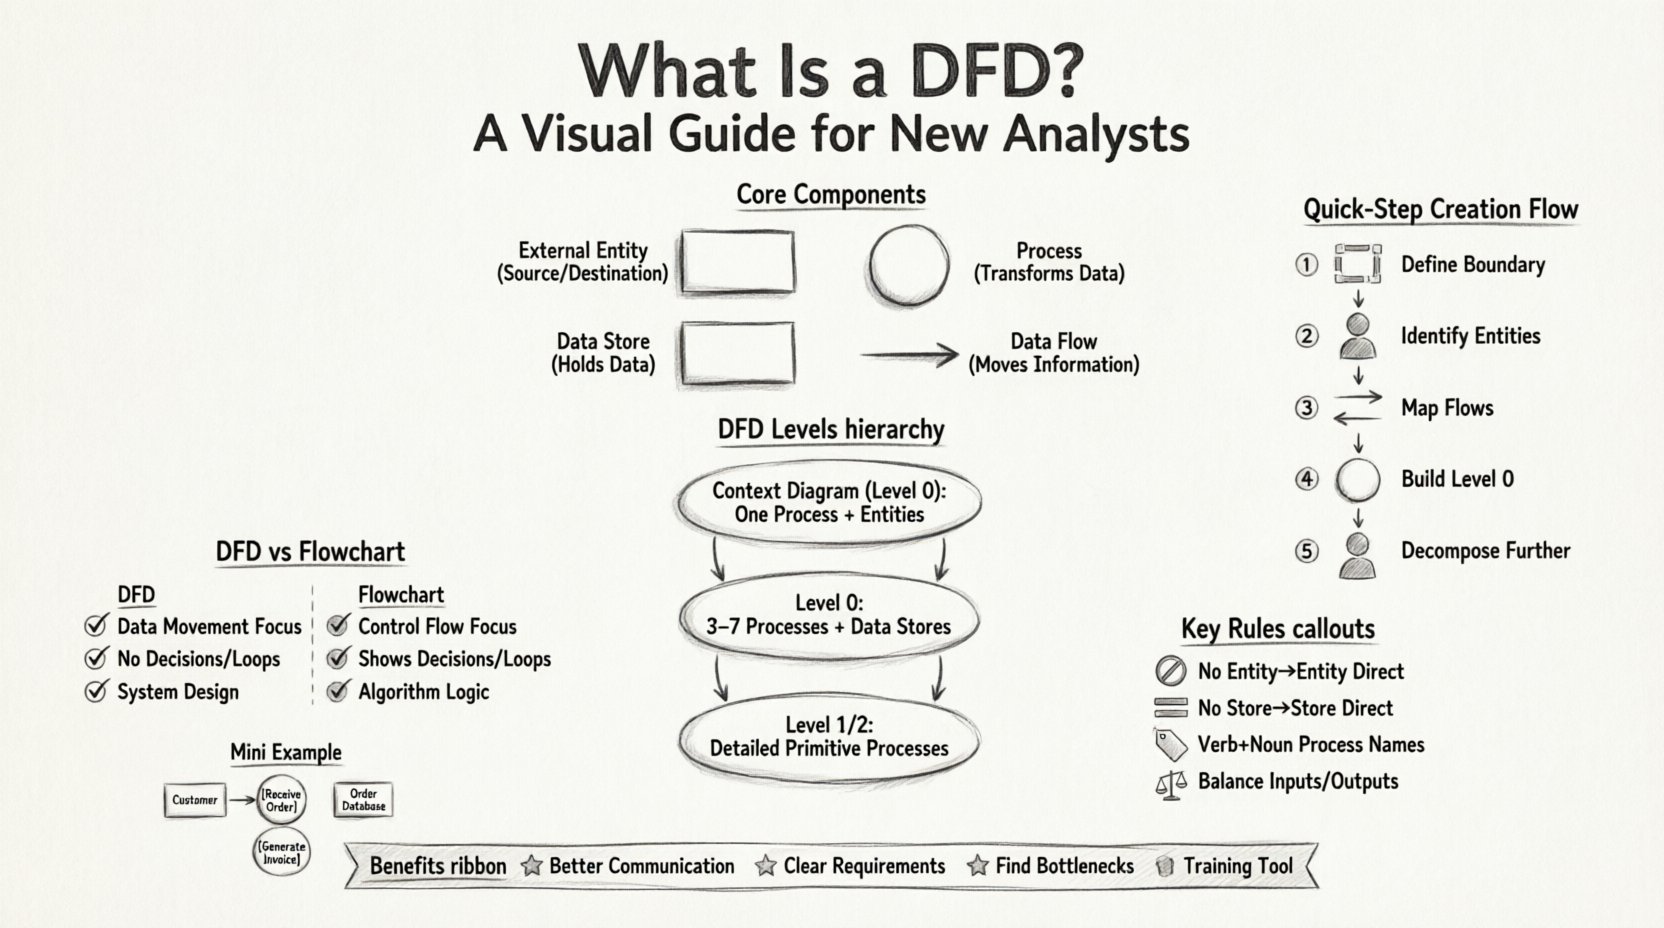
Every DFD is built upon four fundamental symbols. While notation styles vary slightly between methodologies, the underlying concepts remain consistent. To create a valid diagram, you must understand the role of each element.
| Component | Symbol Description | Function |
|---|---|---|
| External Entity | Rectangle or Square | Source or Destination of Data |
| Process | Circle or Rounded Rectangle | Transforms Data |
| Data Store | Open Rectangle or Parallel Lines | Stores Data for Later Use |
| Data Flow | Arrow | Moves Data Between Components |
DFDs are typically created in a series of levels, moving from high-level abstraction to detailed specifics. This technique is known as decomposition. It allows stakeholders to understand the big picture before diving into the minutiae.
The Context Diagram is the highest-level view. It represents the entire system as a single process. It shows the system’s boundaries and how it interacts with the outside world. This diagram answers the question: “What is the system, and who talks to it?”
Once the context is established, the single process is exploded into major sub-processes. This diagram shows the high-level functional areas of the system. It introduces data stores and breaks down the data flows into more manageable chunks.
Further decomposition occurs at lower levels. Level 1 details the processes from Level 0, and Level 2 details specific processes from Level 1. The goal is to reach a level where every process is a primitive process—a step that cannot be broken down further without losing meaning.
Building a Data Flow Diagram is a systematic process. Following a structured approach ensures accuracy and consistency throughout the modeling lifecycle.
Before drawing anything, identify what is inside the system and what is outside. This defines the scope of your analysis. Everything that generates data for the system or receives data from it is an External Entity. Everything that happens within the organization or software is internal.
List all the users, departments, or external systems involved. Give them clear, descriptive names. Avoid vague terms like “User” if possible; use “Customer” or “Admin” instead. This sets the stage for the Context Diagram.
Draw arrows connecting the entities to the central process. Label each arrow with the specific data being exchanged. For example, use “Order Details” instead of just “Data”. This ensures clarity for anyone reading the diagram later.
Break the central process into major functions. Identify where data is saved. Ensure that every data flow from the Context Diagram still exists here. This is often called balancing. If the Context Diagram shows an “Invoice” leaving the system, Level 0 must also show an “Invoice” leaving the system.
Take a complex process from Level 0 and break it down into smaller steps for Level 1. Repeat this until the processes are simple enough to be understood as single actions. Ensure that data stores are not bypassed and that all flows are accounted for.
To maintain the integrity of the model, analysts must adhere to specific rules. Violating these rules can lead to confusion and inaccurate system designs.
Even experienced analysts make errors when modeling. Recognizing these pitfalls early can save significant time during the review phase.
Confusion often arises between Data Flow Diagrams and Flowcharts. While they look similar, they serve different purposes.
| Feature | Data Flow Diagram (DFD) | Flowchart |
|---|---|---|
| Focus | Focuses on data movement and transformation. | Focuses on control flow and decision logic. |
| Logic | Does not show decision points or loops. | Explicitly shows decisions (diamonds) and loops. |
| Timing | Does not indicate sequence or timing. | Indicates the order of operations. |
| Usage | Requirements analysis and system design. | Algorithm design and implementation logic. |
Understanding this distinction ensures you use the right tool for the right job. If you need to define how a decision is made, use a flowchart. If you need to define what data is needed to support a decision, use a DFD.
Why invest time in creating these diagrams? The value extends beyond documentation.
To ensure your diagrams are professional and effective, consider these practical tips.
To illustrate how these concepts apply in a real scenario, consider an Order Processing System.
Context Diagram:
Level 0 Diagram:
Level 1 Diagram (Decomposing Process 2.0):
This breakdown shows how a single high-level requirement transforms into actionable system components without needing to name specific software tools.
Data Flow Diagrams remain a cornerstone of systems analysis. They provide a structured way to think about data movement and system boundaries. By following the rules of decomposition, maintaining consistent naming, and avoiding common pitfalls, analysts can create models that are both accurate and useful. The goal is not just to draw lines, but to understand the flow of information that drives business value.
For new analysts, starting with a clear Context Diagram and working downwards is the most reliable path. Remember that the diagram is a living document. As requirements change, the diagram should evolve to reflect the new reality. This flexibility ensures that the system documentation remains relevant throughout the project lifecycle.
By mastering these fundamentals, you equip yourself with a powerful tool for analysis and design. The ability to visualize data flow is a skill that translates across industries and technologies. Whether you are working on web applications, enterprise software, or internal workflows, the principles of the Data Flow Diagram apply universally.