 Visual Paradigm Desktop |
  Visual Paradigm Online


Data Flow Diagrams (DFDs) are essential tools for visualizing how information moves through a system. Whether you are designing a new application, mapping out a business process, or analyzing an existing workflow, understanding the flow of data is critical. This guide breaks down the concept of DFDs into manageable parts, focusing on clarity and practical application.
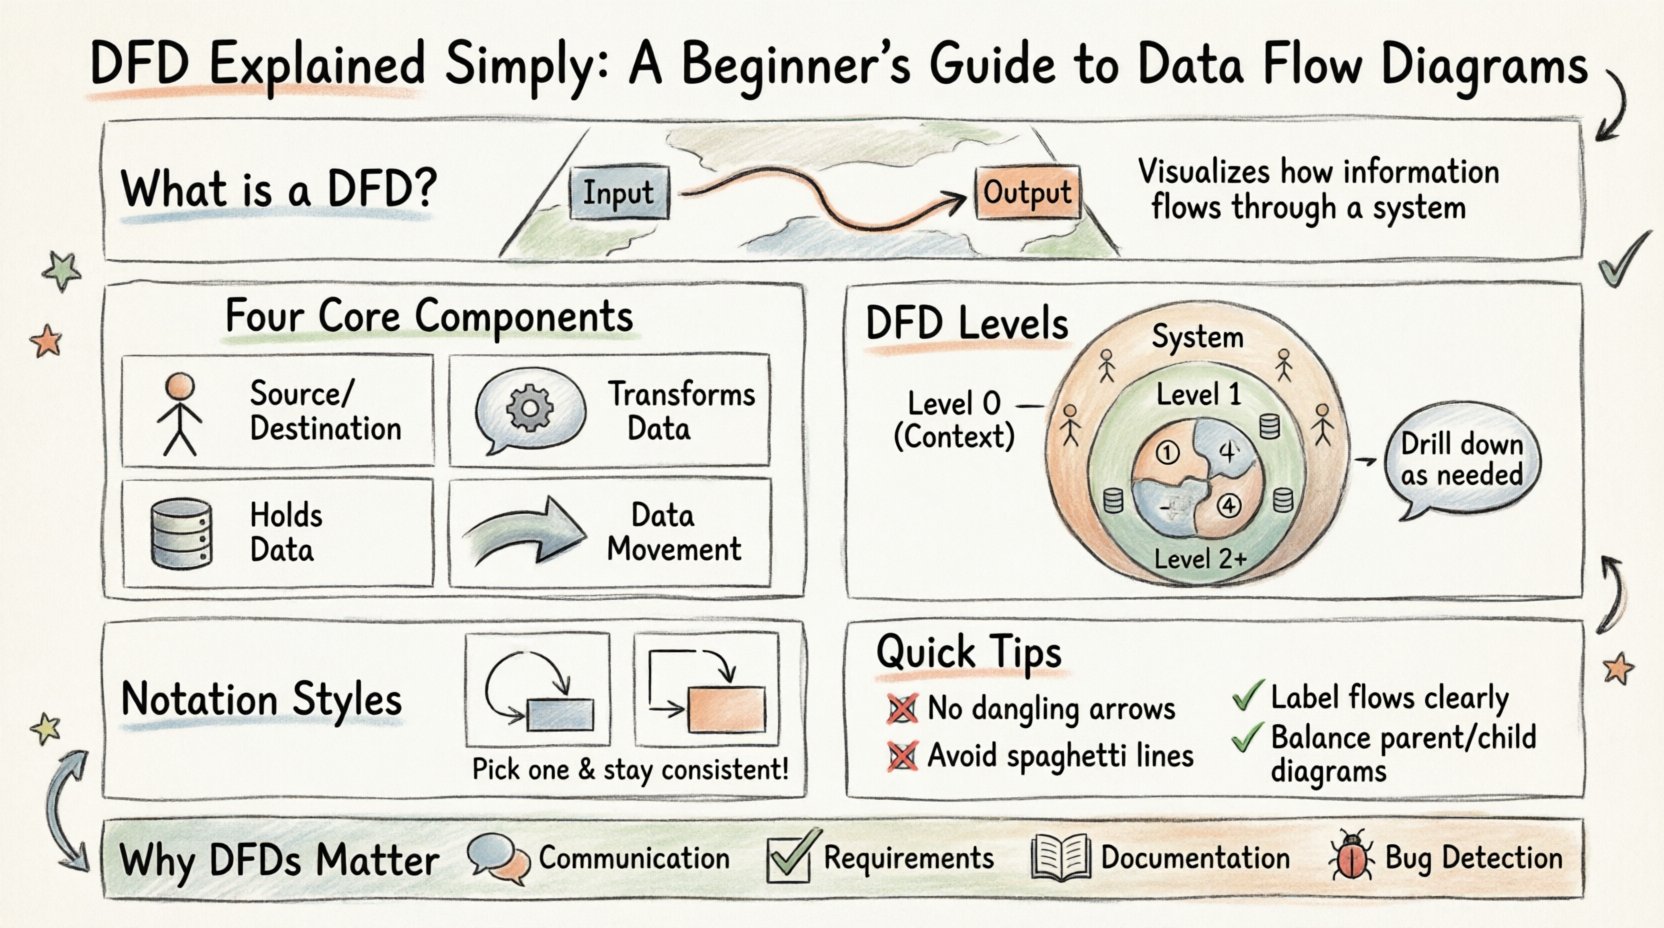
A Data Flow Diagram is a graphical representation of the flow of data through an information system. Unlike flowcharts, which focus on control logic and decision points, DFDs focus on the movement of data from an input source to an output destination. They help stakeholders understand what data is needed, where it comes from, how it is processed, and where it ends up.
Think of a DFD as a map for your system’s information. It does not show the timing or the sequence of events in a linear sense, but rather the connectivity and transformation of data. This makes it particularly useful for system analysts and developers during the requirements gathering phase.
To build a valid DFD, you must understand the four fundamental building blocks. Every diagram is constructed using these elements. Using them correctly ensures the diagram accurately reflects the system’s logic.
It is important to note that data cannot simply appear or disappear. Every input must result in an output, or be stored. This principle is known as conservation of data.
DFDs are hierarchical. You start with a high-level view and break it down into more detailed views as needed. This technique allows you to manage complexity by hiding details until they are necessary.
The Context Diagram is the highest level of abstraction. It shows the system as a single process and its interactions with external entities. There are no data stores in a context diagram. It answers the question: “What is the main function of this system?”
The Level 1 Diagram decomposes the single process from the Context Diagram into major sub-processes. This is where you start to see the internal structure. You will see data stores and more specific data flows.
If a process in the Level 1 diagram is too complex, you can decompose it further into a Level 2 Diagram. This drill-down continues until the processes are simple enough to be implemented. Typically, you stop when the logic is clear enough for coding or execution.
There are two primary styles for drawing DFDs. While they represent the same logical concepts, the symbols differ slightly. Choosing the right notation depends on your team’s preference or industry standards.
| Component | Yourdon & DeMarco | Gane & Sarson |
|---|---|---|
| Process | Rounded Rectangle | Rectangle with Rounded Corners |
| Data Store | Open Rectangle | Rectangle with one side open |
| External Entity | Rectangle | Rectangle |
| Data Flow | Curved Arrow | Straight Arrow |
Both notations are valid. The key is consistency. If your team uses Gane & Sarson, stick with it for all diagrams. Mixing notations can confuse readers and obscure the meaning of the diagram.
Creating a DFD is a logical exercise. You do not need specific tools to start, though software can help with maintenance. Follow these logical steps to construct a meaningful diagram.
Define the boundaries of the system. What is inside the system, and what is outside? This determines which entities are external and which processes are internal. If a process is outside the system boundary, it is an external entity.
Start with the big picture. Place the system as a single bubble. Draw the external entities that interact with it. Draw the major data flows between them. This ensures you understand the high-level inputs and outputs before diving into details.
Take the main process from the Context Diagram and split it into sub-processes. Ask yourself: “What are the major steps involved?” Add data stores where information is kept between steps. Ensure that every data flow connects to a process or a store.
Check your work against the parent diagram. This is called balancing. The inputs and outputs of a decomposed process must match the inputs and outputs of the parent process. If you add a new input in the Level 1 diagram, it must be explained in the Level 0 diagram.
Walk through the diagram with stakeholders. Do the data flows make sense? Are the labels clear? Is there any data flow that is missing a destination? A diagram is only useful if it is accurate and readable.
Even experienced analysts make mistakes when creating DFDs. Being aware of common errors can save you time and prevent confusion later.
The value of a Data Flow Diagram extends beyond just drawing pictures. It serves several critical functions in the development lifecycle.
DFDs bridge the gap between technical and non-technical stakeholders. A diagram is easier to understand than a technical specification document. Business users can look at a DFD and confirm if the system matches their expectations.
Creating a DFD forces you to identify all data requirements. You cannot draw a flow without knowing what data is moving. This reveals missing requirements early in the process.
As the system evolves, the DFD serves as documentation. New developers can look at the diagram to understand how data moves through the application without reading every line of code.
Logical errors often appear in the diagram. If data flows into a process but no output leaves, you have a logic error. If data goes to a store but never comes out, you have a data integrity issue.
It is important to distinguish between the logical and physical aspects of your system.
Start with the logical DFD to get the business logic right. Once the logic is validated, create the physical DFD to guide the developers.
Yes. DFDs are useful for any system involving data flow. This includes manufacturing processes, administrative workflows, or logistics chains.
Not directly. DFDs focus on data movement. Decision points are often implied by the branching of data flows, but they are not the primary focus. Flowcharts are better for showing logic paths.
Labels should be concise but descriptive. A data flow might be labeled “Customer Order,” while a process might be “Validate Order.” Avoid vague terms like “Data” or “Info”.
No. An Entity-Relationship (ER) Diagram focuses on the structure of data (tables and relationships). A DFD focuses on the movement and transformation of data (processes and flows).
Data Flow Diagrams are a foundational skill for anyone involved in system design or analysis. They provide a clear, visual language for discussing complex systems. By mastering the components, levels, and notation styles, you can create diagrams that clarify requirements and guide development.
Remember that a diagram is a tool for thinking, not just a final product. Use DFDs to explore ideas, identify gaps, and communicate with your team. With practice, you will find that visualizing data flow becomes second nature.