 Visual Paradigm Desktop |
  Visual Paradigm Online


Understanding how users interact with your product is the foundation of successful development. For Agile Product Managers, visualizing these interactions clearly is essential before writing a single line of code. This guide covers everything you need to know about Use Case Diagrams. We will explore the core components, relationships, and how to integrate this technique into your Agile workflow without adding unnecessary overhead.
Whether you are refining a backlog or clarifying requirements for a sprint, a well-structured diagram bridges the gap between business goals and technical execution. This handbook is designed to help you build clarity and alignment across your team.
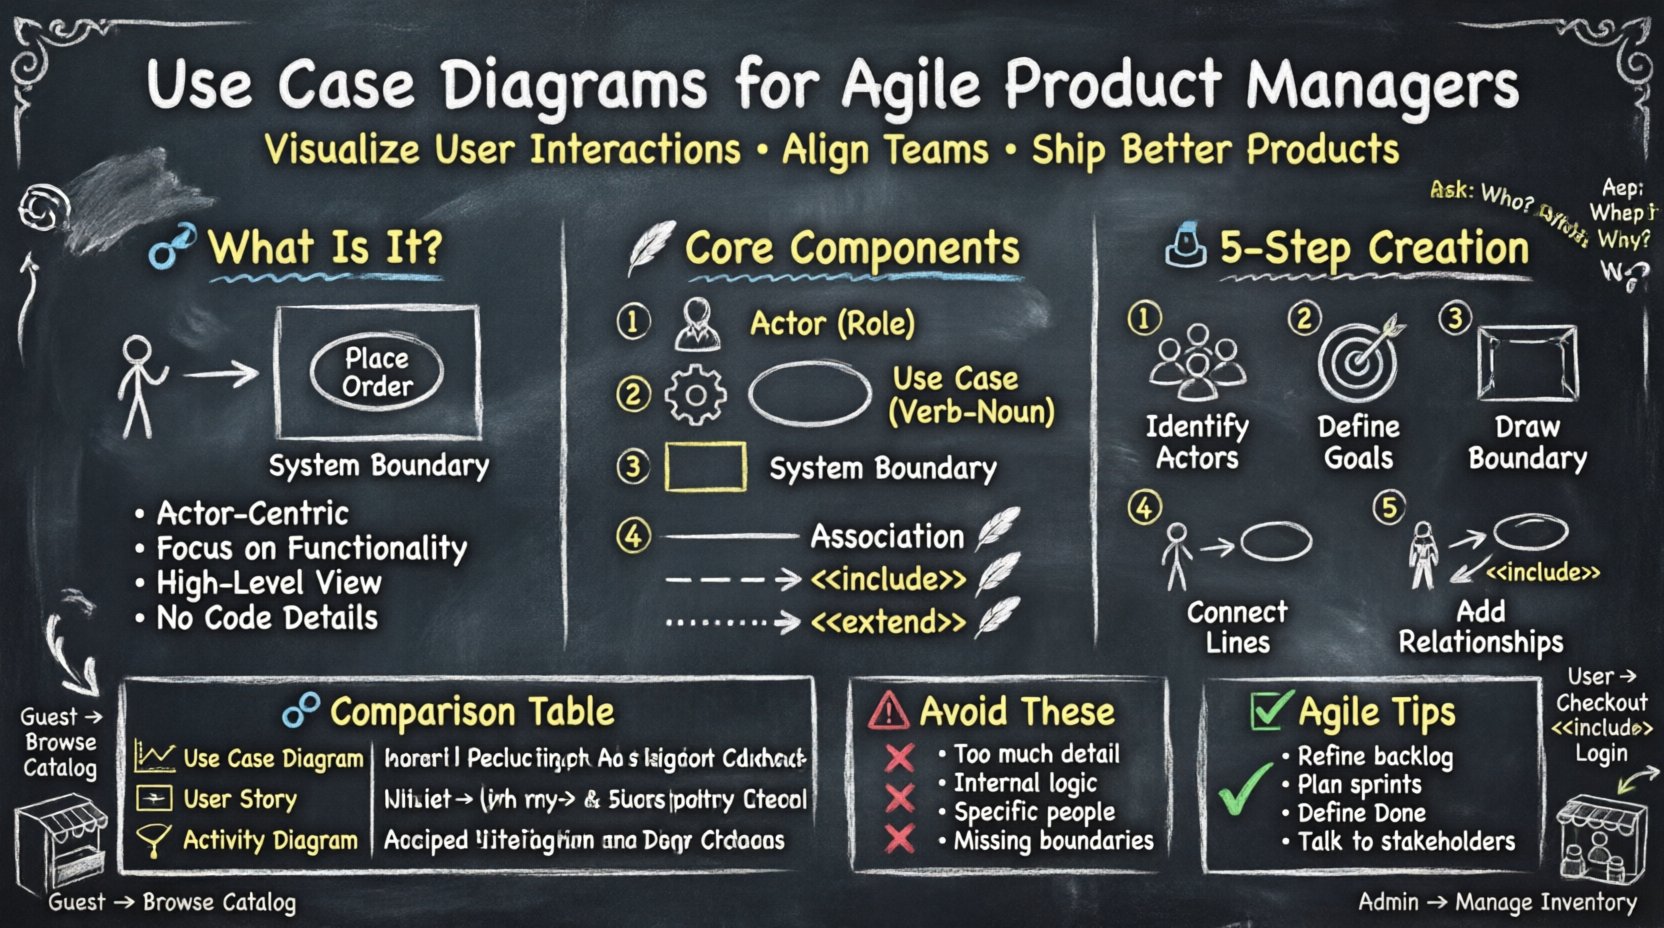
A Use Case Diagram is a visual representation of the interactions between users (actors) and a system. It focuses on the functionality provided by the system rather than the internal logic or implementation details. In Agile environments, these diagrams serve as a high-level map of user needs.
Unlike detailed flowcharts, Use Case Diagrams do not show the sequence of steps. Instead, they answer the question: “What can the system do?” from the perspective of the people using it.
Key characteristics include:
To create an effective diagram, you must understand the standard symbols and their meanings. These elements remain consistent regardless of the tool you use to draw them.
An actor represents a role played by a user or an external system interacting with the main system. Actors are typically depicted as stick figures.
A use case represents a specific goal or function the system performs. These are often drawn as ovals inside the system boundary.
The system boundary is a rectangle that encloses all the use cases. Everything inside this box is part of the system. Everything outside is external.
Lines connect actors to use cases and use cases to other use cases. These lines define how the elements interact.
Creating a diagram requires collaboration and a clear understanding of the problem domain. Follow this process to ensure accuracy and team alignment.
Start by listing everyone who interacts with the system. Ask questions like:
Write these down on a whiteboard or sticky notes. Group similar roles together.
For each actor, ask what they want to achieve. These goals become the use cases.
Draw a large rectangle. Label it with the name of the system or application. Place all identified use cases inside this rectangle.
Draw solid lines from the actor to the use cases they interact with. Ensure every line represents a direct interaction.
Refine the diagram by adding complexity where necessary.
Agile teams often confuse these three artifacts. Understanding the distinction helps you choose the right tool for the right job.
| Artifact | Focus | Best Used For | Level of Detail |
|---|---|---|---|
| Use Case Diagram | System Functionality | High-level requirements and scope | Medium (Overview) |
| User Story | User Value | Backlog items and sprint planning | High (Specific criteria) |
| Activity Diagram | Process Flow | Complex logic and decision paths | Very High (Step-by-step) |
Use Case Diagram: Use this during the discovery phase to define what the system does. It is great for onboarding new team members.
User Story: Use this during sprint planning to define the specific work to be done. It follows the format: “As a [role], I want [feature], so that [benefit].”
Activity Diagram: Use this when the logic is complex. If a process involves many decision points, loops, or parallel paths, a diagram showing the flow is better than a simple use case.
Relationships add depth to your diagram. They clarify dependencies between functions.
This relationship indicates that one use case must incorporate another. It is mandatory.
This helps developers know that certain steps are non-negotiable parts of a larger process.
This relationship indicates optional behavior that happens only under specific conditions.
Use extends sparingly. Overusing them can make the diagram confusing.
This is used when one actor or use case is a specialized version of another.
This reduces redundancy in your diagram by showing shared behavior.
Agile emphasizes iteration and feedback. Static diagrams can feel outdated quickly. Here is how to keep them relevant.
During refinement sessions, use the diagram to ensure no functionality is missed. If a new feature is proposed, check if it fits within the existing system boundary. If not, it might be a new system entirely.
When selecting stories for a sprint, refer to the diagram to see how stories connect. If a story depends on a specific use case, ensure the actor and interaction are clear.
Use the diagram to verify completeness. If a use case on the diagram has not been addressed in the sprint, it should not be marked as complete.
Use cases are excellent for communicating with non-technical stakeholders. They provide a visual summary of the product capabilities without overwhelming them with technical details.
Even experienced Product Managers make errors when creating these diagrams. Watch out for these pitfalls.
Let us look at a practical example to solidify these concepts. Imagine an online store.
Software evolves. Your diagrams must evolve with it. A static diagram becomes a liability if it does not match reality.
While powerful, these diagrams are not always the best choice. Know when to skip them.
How do you know if your use case diagrams are working?
Integrating Use Case Diagrams into your Agile practice takes time. Start small. Pick one feature and map it out. Share it with your team. Gather feedback. Iterate on the diagram itself.
Remember, the goal is not perfection. The goal is communication. A simple diagram that clarifies a complex idea is worth more than a perfect one that no one understands.
By mastering the basics of actors, use cases, and relationships, you build a stronger foundation for your product. This foundation supports your backlog, guides your sprints, and ensures your team is building the right thing.
Keep your diagrams visible. Keep them updated. And keep them focused on the user.