 Visual Paradigm Desktop |
  Visual Paradigm Online


In the complex landscape of product development, a persistent challenge remains the alignment between technical functionality and user experience. Teams often build systems based on abstract requirements that fail to capture the actual emotional and logical flow of the customer. To bridge this gap, professionals are turning to visual modeling techniques that prioritize interaction over infrastructure. Specifically, the use case diagram offers a robust framework for mapping customer journeys. By shifting the focus from database schemas to user goals, organizations can create systems that feel intuitive and responsive.
This guide explores how to leverage use case diagrams for customer journey mapping. We will examine the structural elements, the process of translation, and the strategic advantages of this visual approach. No specialized software is required to begin; the value lies in the structured thinking and the clarity of communication it fosters across departments.
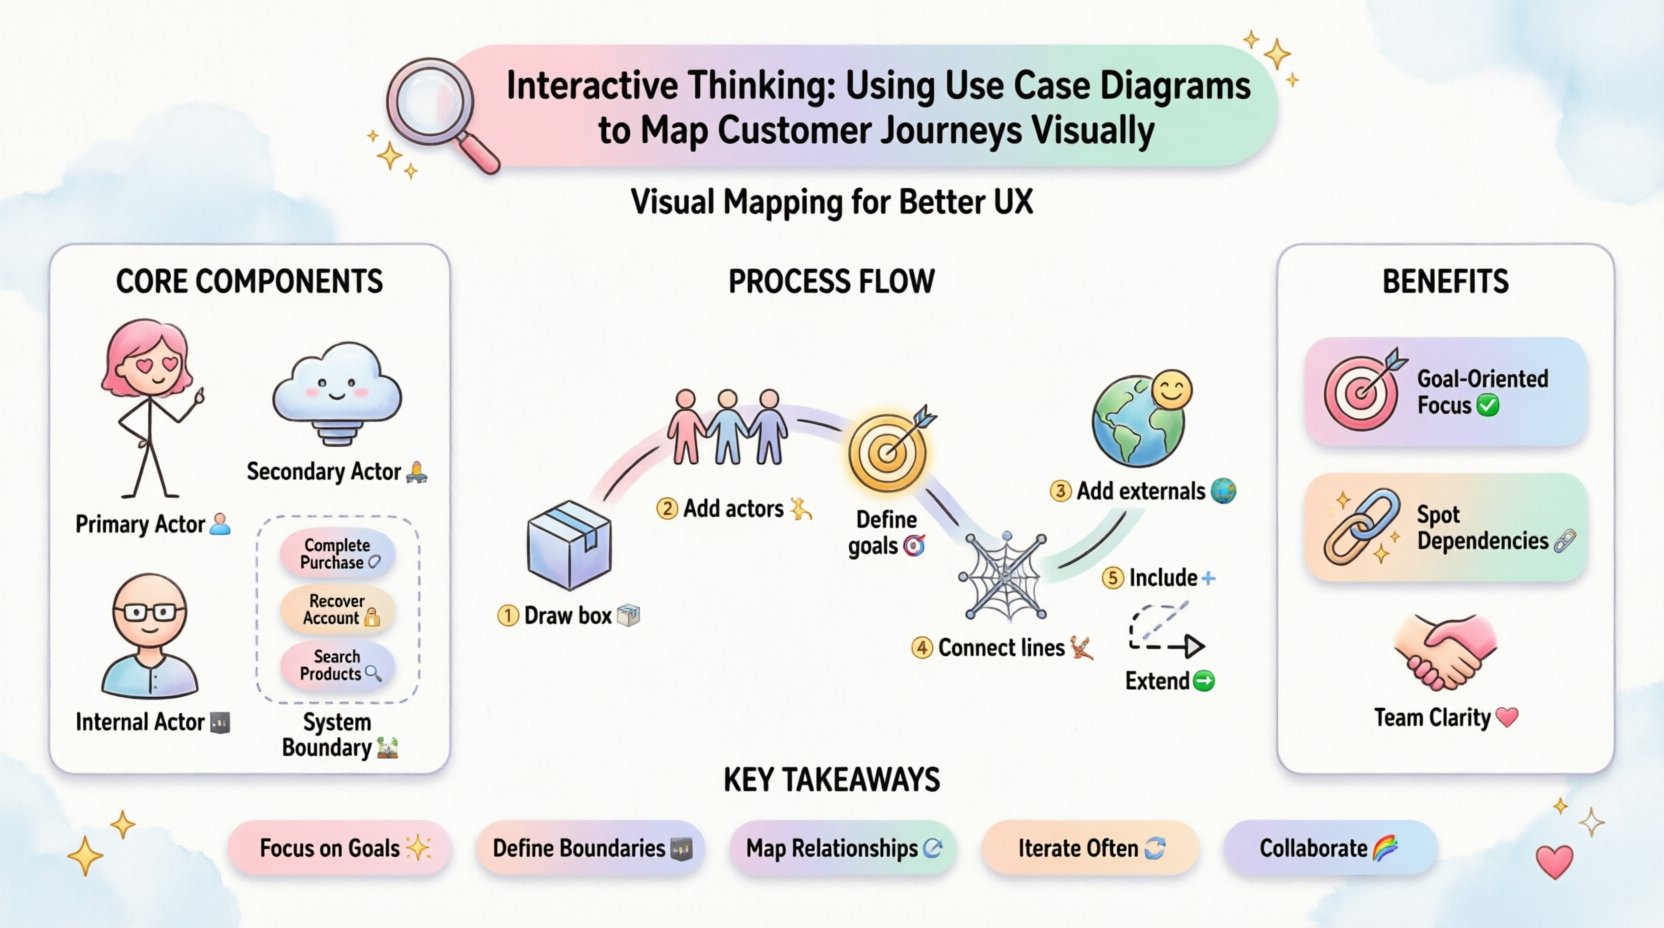
Before mapping a journey, one must understand the building blocks of a use case diagram. Unlike a flowchart, which emphasizes the sequence of operations, a use case diagram emphasizes the interaction between an entity and a system. This distinction is critical when analyzing customer experiences.
An actor represents an external entity that interacts with the system. In the context of a customer journey, the actor is rarely just a human user. It includes:
The system boundary defines what is inside the scope of the project and what remains external. Drawing this line clearly prevents scope creep and ensures that the journey mapping focuses on the experience within the product.
A use case describes a specific goal or outcome that an actor wants to achieve. It is not a task or a screen; it is the why behind the action.
Traditional journey mapping often relies on linear timelines or empathy maps. While valuable, these methods can sometimes obscure the functional dependencies required to make the journey possible. Use case diagrams provide a complementary view that grounds the journey in system reality.
Customer journeys are defined by goals. Users do not walk into a store to “browse shelves”; they walk in to “find a specific item.” Use case diagrams force the team to define these goals explicitly. This prevents feature bloat where functionality is added without a clear user intent.
A journey often relies on backend processes that users never see. A use case diagram reveals these hidden dependencies. For instance, a “Process Return” journey might depend on a “Verify Warranty Status” use case. Visualizing this relationship helps teams anticipate friction points before development begins.
Stakeholders from different backgrounds interpret requirements differently. Engineers think in logic, designers think in visuals, and business leaders think in metrics. A use case diagram serves as a neutral language. Everyone sees the same actors and the same goals, reducing miscommunication during sprint planning and design reviews.
Creating a comprehensive map requires a structured approach. Follow these steps to translate a customer journey into a use case diagram.
Start by drawing a rectangle. This represents your application or service. Label it clearly. Everything outside this box is external. This visual constraint helps you focus on what you can control.
Who is the main person using this system? List them outside the box. In a journey context, you may have multiple primary actors. For example, in a ride-sharing context, you have the Passenger and the Driver. Define their roles clearly.
List the goals the actors want to achieve inside the box. Use verbs to describe these goals. Good use cases are atomic; they represent a single outcome. If a goal seems too complex, break it down into smaller, manageable use cases.
Connect the actors to the use cases with lines. This indicates that the actor initiates or participates in that specific goal. At this stage, you are mapping the Happy Path—the ideal scenario where everything goes right.
Identify where the system interacts with the outside world. Draw additional actors for these external systems. Connect them to the relevant use cases. This highlights the technical requirements needed to support the user journey.
Use case diagrams allow for specific relationship types that clarify the logic. Two key relationships are Include and Extend.
Once the basic structure is in place, you can add depth to the diagram to capture the nuances of the customer journey. This requires looking beyond simple connections.
Every use case has conditions that must be met before it starts and conditions that exist after it finishes.
Documenting these alongside the diagram provides a complete picture of the transaction lifecycle.
A customer journey is rarely linear. Users make mistakes, encounter errors, or choose different paths. A robust diagram accounts for these variations.
As the journey grows, the diagram can become cluttered. Use packages to group related use cases together. This creates a modular view of the system.
Even experienced teams can fall into traps when modeling complex journeys. Use the table below to identify common issues and apply the correct solution.
| Pitfall | Description | Solution |
|---|---|---|
| Too Much Detail | Mapping individual clicks instead of goals. | Focus on the outcome. If a step does not change the state of the system, do not make it a use case. |
| Confusing Actors | Labeling screens or UI components as actors. | Ensure actors are entities outside the system. A “Button” is part of the system, not an actor. |
| Missing Boundaries | Assuming all functionality is internal. | Explicitly draw the box and list external dependencies. Verify which data sources are internal vs. external. |
| Static Diagrams | Creating a map that is never updated. | Review the diagram during every sprint planning session. Update it when features change. |
| Over-Reliance on Extends | Using “Extend” for everything optional. | Reserve “Extend” for rare or specific conditions. Use “Include” for mandatory sub-goals. |
The use case diagram is not an isolated artifact. It serves as the backbone for user experience (UX) and user interface (UI) design. When these disciplines align, the final product is cohesive.
Each use case should correspond to a screen or a significant interaction flow. When designing a wireframe, ask: “Which use case does this screen support?” If a screen does not support a clear use case, it may be unnecessary.
Use cases are the parent of user stories. A single use case can generate multiple user stories for agile development. For example, the “Process Return” use case might yield stories about printing labels, scheduling pickups, and refunding funds. This ensures the development backlog is complete and traceable.
During usability testing, you can validate whether the system supports the intended use cases. If a user cannot complete a specific use case, the diagram highlights exactly where the breakdown occurred. This makes debugging the user experience faster and more precise.
Why invest time in this modeling process? The return on investment comes from alignment and efficiency.
Discovering a gap in the journey during the design phase is cheap. Discovering it after code deployment is expensive. Use case diagrams force teams to think through edge cases and dependencies early. This reduces the cost of change significantly.
Executives and clients often struggle to understand technical specifications. A visual diagram of the journey is intuitive. It shows them exactly how their business goal translates into system behavior. This transparency builds trust and facilitates faster approval processes.
Team members leave projects. Documents get lost. A use case diagram serves as a living record of the system’s intent. It explains not just what the system does, but who uses it and why. This institutional knowledge is vital for long-term maintenance.
A diagram created today is not valid forever. Products evolve, and so do customer behaviors. To maintain the value of the model:
Mapping customer journeys using use case diagrams transforms abstract requirements into a tangible structure. It shifts the conversation from “what features do we need?” to “what goals do our users need to achieve?” This perspective is essential for building products that are not only functional but also empathetic.
By defining actors, boundaries, and interactions clearly, teams create a shared understanding that survives the transition from concept to deployment. The diagram becomes a reference point for design, development, and testing. It ensures that the technical implementation remains faithful to the customer’s intent.
Start small. Pick one core journey. Draw the box. Identify the actors. Define the goals. As the model grows, so does the clarity of your product strategy. This disciplined approach to visual modeling is a cornerstone of modern, user-centric engineering.