 Visual Paradigm Desktop |
  Visual Paradigm Online


Product Managers serve as the critical bridge between business strategy and technical execution. One of the most powerful tools in this translation process is the Use Case Diagram. These visual representations define how users interact with a system, outlining the boundaries, actors, and behaviors involved. However, despite their importance, many Product Managers create diagrams that are misleading, overly complex, or technically inaccurate. When a Use Case Diagram fails, the ripple effect reaches development, testing, and ultimately, the end-user experience.
This guide explores the frequent errors encountered during the creation of these diagrams. We will examine why they happen, the negative impact on the project lifecycle, and provide concrete steps to correct them. By understanding the nuances of UML modeling, Product Managers can ensure their vision is communicated with precision and clarity.
A Use Case Diagram is not merely a drawing exercise. It is a functional specification tool. It answers the question: “What does the system do for the user?” Unlike wireframes, which focus on layout, or flowcharts, which focus on logic flow, Use Case Diagrams focus on interaction. They identify the goals users want to achieve and the system capabilities required to support those goals.
When these diagrams are flawed, several issues arise:
Correcting these errors early saves significant resources later. Let us dive into the specific areas where Product Managers often struggle.
The actor represents an entity that interacts with the system. This is often the first point of confusion. A common error is conflating specific user roles with the system itself, or failing to distinguish between internal and external entities.
Product Managers frequently list every possible human who might touch the software as an actor. For example, listing “Admin,” “Manager,” “Supervisor,” and “User” when they all perform the same actions within the system. This creates noise. Alternatively, they forget to include external systems. If your application sends data to a third-party payment gateway, that gateway is an actor, even if it is software.
When actors are misidentified, the resulting requirements become muddled. The development team cannot determine permission levels accurately. Security requirements may be overlooked if the “Admin” actor is not clearly distinguished from the “User” actor.
To resolve this, apply the following criteria when defining actors:
| Incorrect Approach | Correct Approach | Why It Matters |
|---|---|---|
| Listing every job title (e.g., HR Manager, HR Director) | Grouping by function (e.g., HR Administrator) | Reduces complexity and focuses on permissions. |
| Excluding external APIs | Including external systems as actors | Ensures integration points are tested. |
| Labeling the system itself as an actor | Removing the system from the actor list | Prevents circular logic in diagrams. |
Granularity refers to the level of detail in the diagram. A diagram that is too broad is useless; one that is too detailed is unreadable. Product Managers often oscillate between these two extremes.
On one hand, a diagram might contain only three massive use cases: “Manage Users,” “Process Orders,” and “Generate Reports.” These are too vague to guide development. On the other hand, a diagram might list every single button click as a separate use case (e.g., “Click Save,” “Click Cancel,” “Click Submit”). This violates the principle that a Use Case represents a unit of value delivered to the actor.
Overly broad use cases lead to “feature bloat” where teams assume everything is in scope. Overly granular use cases make the diagram look like a wireframe, cluttering the visual space and obscuring the actual user goals.
Aim for a “Goal-Oriented” approach. A Use Case should describe a complete task that provides value to the user.
UML defines specific relationships between actors and use cases, as well as between use cases themselves. Misusing these relationships creates logical errors in the requirements.
The two most common relationships are Association, Include, and Extend. Product Managers often treat them interchangeably. For instance, using an Include relationship for an optional feature, or using an Association line where an Include is required.
Confusion here leads to logical gaps. If a developer sees an Include relationship, they understand that the included use case is mandatory for the base use case to complete. If they see Extend, they know it is optional. Mixing these up causes build failures or logic errors in the code.
Adhere to the strict definitions of these relationships:
The system boundary (often drawn as a rectangle) defines what is inside the software and what is outside. A common error is drawing the boundary too tightly or too loosely.
Some Product Managers draw the box around the specific feature they are building, leaving out dependencies that are technically part of the current release. Others draw the box around the entire company infrastructure. This ambiguity makes it unclear what the development team is responsible for.
When the boundary is unclear, integration work becomes a source of conflict. The frontend team might assume the backend team handles a specific validation, while the backend team assumes it is a frontend concern. This leads to “passing the buck” during the sprint cycle.
Define the boundary based on the Release Scope. The box should enclose all components that are being built, modified, or maintained as part of this specific iteration. External systems that are read-only or strictly third-party should remain outside the box.
Diagrams are often created during the planning phase and then abandoned. As the product evolves, the diagram becomes stale. This is a critical oversight. A diagram that does not match the current system is worse than no diagram at all, as it actively misleads.
Product Managers focus heavily on the initial creation but fail to establish a process for updates. When a new feature is added, the diagram is often updated manually in a tool, but the changes are not communicated to the team. The diagram becomes a “ghost” artifact.
Onboarding new team members becomes difficult. They study the documentation and see features that no longer exist. Technical debt increases because developers rely on old mental models rather than current reality.
Integrate diagram maintenance into the standard workflow.
Use Case Diagrams primarily show functional behavior. However, Product Managers often fail to annotate critical constraints within the diagram or its associated documentation.
A Use Case might be drawn correctly, but it fails to specify performance requirements. For example, “Search Database” is a valid use case. But does it need to return results in under 200ms? Does it need to handle 10,000 concurrent users? These are not captured in the visual shape of the diagram.
Performance bottlenecks are discovered late in the testing phase. The system might function correctly logically, but it fails under load because the non-functional requirements were not highlighted during the design phase.
Use notes or separate documentation blocks linked to specific use cases to highlight constraints.
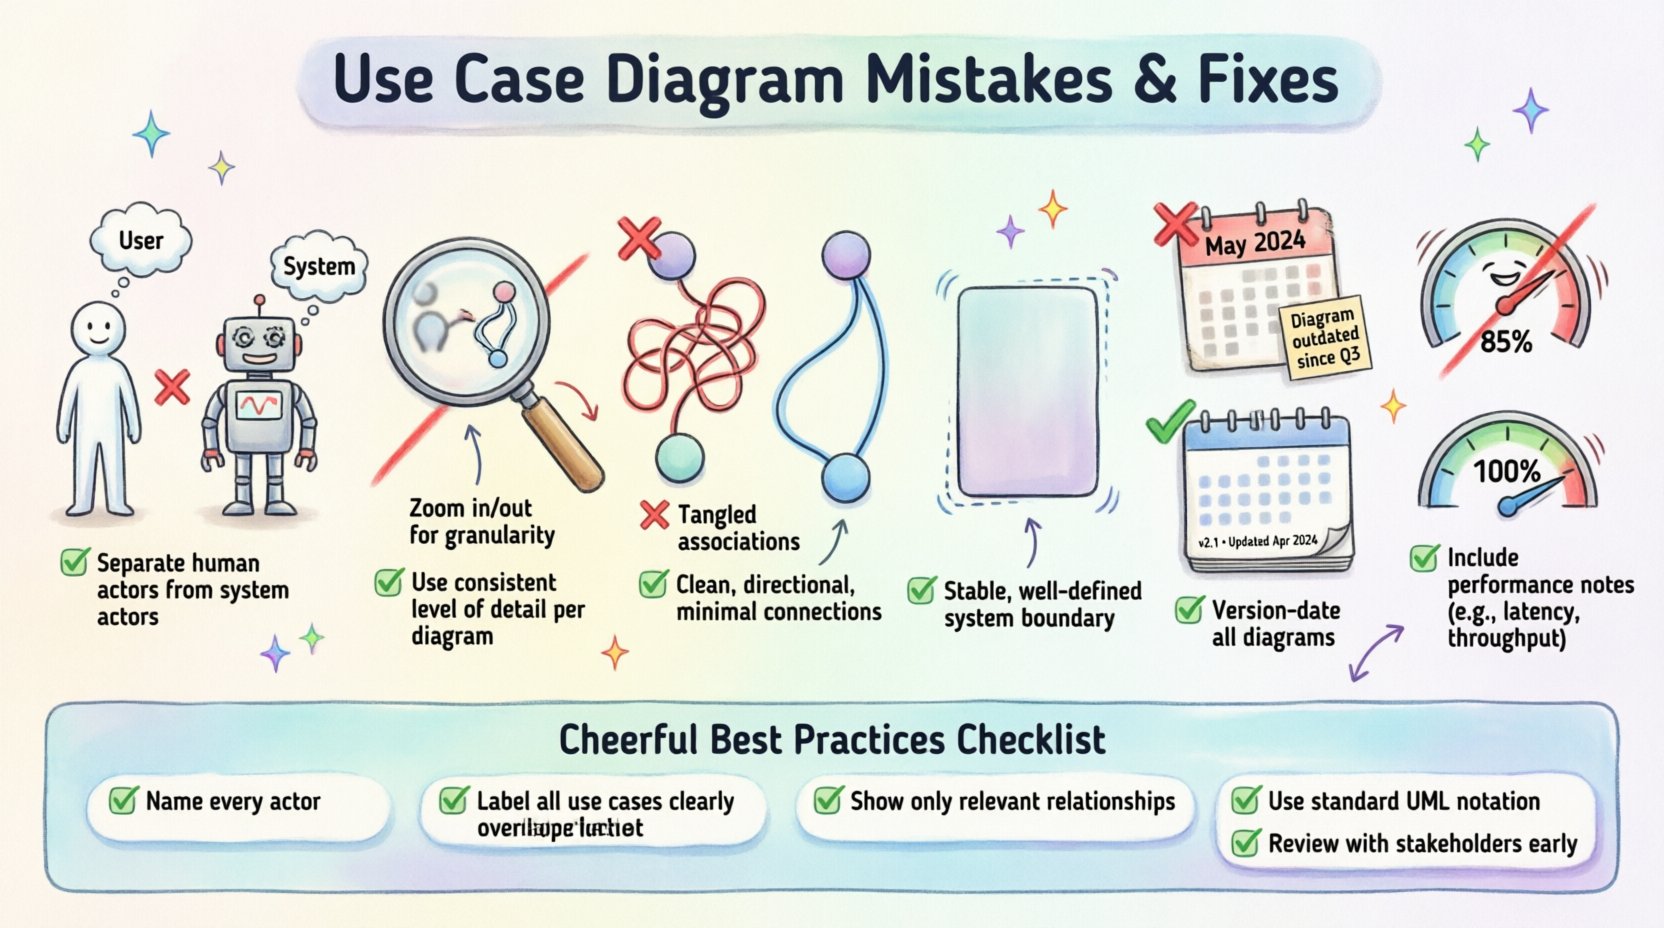
To ensure your Use Case Diagrams are effective, review your work against this checklist before presenting it to stakeholders and engineering teams.
One of the most subtle mistakes is creating a Use Case Diagram that does not align with the written requirements. This creates a disconnect between the “what” (requirements) and the “how” (visuals). Product Managers must ensure that every use case on the diagram has a corresponding entry in the requirements specification.
If a use case is drawn but has no requirement text, it is a scope creep risk. If a requirement exists but has no use case, it is an undocumented feature. This alignment ensures traceability. When a bug is reported, engineers can trace it back to a specific use case interaction. When a feature is requested, PMs can verify if it fits the existing diagram structure.
To maintain this alignment:
Creating a Use Case Diagram is not about drawing pretty shapes. It is about defining the contract between the user and the software. When Product Managers invest time in getting this right, they reduce ambiguity, streamline development, and improve the final product quality.
By avoiding common pitfalls like actor confusion, incorrect granularity, and relationship errors, you establish a solid foundation for your product roadmap. Remember that these diagrams are living documents. They should evolve with the product. Treat them with the same respect you give to your codebase or your business strategy.
Apply these fixes consistently. Audit your current diagrams against the mistakes listed above. If you find errors, take the time to correct them now. The cost of fixing a diagram is a fraction of the cost of fixing a deployed feature that was built based on a misunderstood requirement.
Clarity is a competitive advantage. Ensure your team understands exactly what they are building by using these diagrams as a tool for precision, not just decoration.