Mastering UML Component Diagrams: A Comprehensive Guide

Uncategorized1 week ago

In the world of object-oriented system design, visualizing the physical structure of a system is just as crucial as understanding its logical behavior. UML Component Diagrams serve this exact purpose. They are designed to model the physical aspects of object-oriented systems, providing a clear view of how components differ, interact, and form a complete software architecture.

Mastering the Art of UML Component Diagrams: A Guide to Software ...

This comprehensive guide will walk you through the definition, notations, relationships, and practical applications of Component Diagrams, helping you document system architecture effectively.

Key Concepts

Before diving into complex diagrams, it is essential to understand the foundational terminology used in Component Diagrams. These definitions form the building blocks of your models.

  • Component: A modular part of a system that encapsulates its contents. Its manifestation is replaceable within its environment. A component defines its behavior in terms of provided and required interfaces.
  • Interface: A collection of operations that specify a service of a class or component.
    • Provided Interface: Represented by a “lollipop” symbol (a complete circle). It indicates functionality that the component offers to other elements.
    • Required Interface: Represented by a “socket” symbol (a half-circle). It indicates functionality that the component needs from other elements to perform its duties.
  • Port: A square represented along the edge of a component. Ports are used to expose provided and required interfaces, acting as a gateway for data flow.
  • Subsystem: A specialized version of a component classifier. It follows the same rules but is explicitly labeled with the keyword subsystem.

What is a Component Diagram?

UML Component diagrams are essentially class diagrams with a specific focus on a system’s components. They are used to model the static implementation view of a system. By breaking down the actual system under development into high levels of functionality, these diagrams help architects and developers understand the structural organization of dependencies.

Component Diagram at a Glance

In a standard diagram, each component is responsible for a distinct aim within the system. Components interact only with essential elements on a need-to-know basis. A typical flow involves:

  1. Input: Data flows into the component via a port (often converting formats).
  2. Processing: Data passes through internal components or logic.
  3. Output: Data exits via provided interfaces to be used by other parts of the system.

Note: A component can represent the overall system (a large box surrounding internal parts) or a single subsystem within a larger architecture.

Visual Notation and Relationships

Graphically, a component diagram is a collection of vertices and arcs. Understanding the specific notation is vital for creating readable models.

Component Representation

In UML 2, a component is drawn as a rectangle with optional compartments. It typically includes:

  • A rectangle containing the component’s name.
  • A component icon (often a small rectangle with two smaller rectangles protruding from the left).
  • Stereotype text (e.g., <<component>>, <<file>>, or <<database>>).

Relationships

Components are connected via various relationships that define how they interact physically and logically.

  • Dependency: A relationship where one element (the client) requires another element (the supplier) for its specification or implementation. If the supplier changes, the client is affected.
  • Association: Specifies a semantic relationship between typed instances, connecting properties.
  • Composition: A strong form of aggregation where a part instance belongs to at most one composite. If the composite is deleted, the parts are deleted.
  • Aggregation: A “shared” relationship, indicating a weaker form of ownership than composition.
  • Generalization: A taxonomic relationship where a specific classifier inherits features from a general classifier.
  • Realization: Often used with interfaces, indicating that a component implements the behavior defined by an interface.

Examples and Modeling Scenarios

Component diagrams are versatile and can be applied to source code, executables, and databases.

1. Modeling Source Code

Component Diagram Java Source Code Example

You can model source code files (C++, Java, etc.) as components to visualize compilation dependencies. This is useful for forward and reverse engineering.

  • Strategy: Identify source code files and model them as components with the stereotype <<file>>.
  • Versioning: Use tagged values to indicate version numbers, authors, and modification dates.
  • Grouping: For larger systems, use packages to group related source code files.

2. Modeling an Executable Release

When modeling deployment, you identify the set of components that live on a specific node.
Component Diagram Modeling Executable Relesase

  • Strategy: Focus on components like executables, libraries (DLLs), and documents.
  • Interfaces: explicitly model exported (realized) and imported (used) interfaces to expose the “seams” of your system. Alternatively, use simple dependencies for a high-level abstraction.

3. Modeling a Physical Database

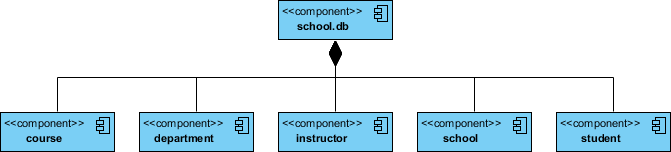
Component diagrams can visualize the mapping between logical classes and physical database tables.
Component Diagram Modeling Physical Database

  • Strategy: Create components stereotyped as <<tables>>.
  • Mapping: Connect these table components to the logical classes they represent. This helps in understanding data distribution and storage locations in the deployed system.

VP AI: Automating Component Diagrams

Creating complex component diagrams manually can be time-consuming. Visual Paradigm AI transforms this process by leveraging artificial intelligence to automate and enhance modeling.

  • Text-to-Diagram: You can describe your system’s architecture in natural language (e.g., “An Order System component that requires an Authentication interface and provides a Payment interface”). VP AI analyzes this text and automatically generates a standard UML Component Diagram.
  • Intelligent Suggestions: The AI can analyze your existing model and suggest missing dependencies or potential interface conflicts, ensuring your architecture is robust.
  • Documentation Generation: VP AI can read your visual diagram and generate comprehensive documentation, describing each component and its relationships, saving hours of manual writing.

Conclusion

UML Component Diagrams are indispensable for developers and architects aiming to document the physical structure of a system. Whether you are modeling source code dependencies, planning an executable release, or mapping a physical database, these diagrams provide the necessary clarity.

To get started, creating these diagrams doesn’t have to be expensive or difficult. Visual Paradigm Community Edition is an award-winning, free UML software that supports all UML diagram types. It offers an intuitive interface to help you learn and apply UML faster.

Ready to streamline your software architecture? Download Visual Paradigm today and turn every software project into a successful one.

Resources

Mastering State Diagrams in UML: A Comprehensive Guide – Visual Paradigm Guides

https://guides.visual-paradigm.com/mastering-state-diagrams-in-uml-a-comprehensive-guide/

Page 31 of 43 – Just another WordPress site – Visual Paradigm Guides

https://guides.visual-paradigm.com/page/31/

UML Archives – Page 6 of 9 – Visual Paradigm Guides

https://guides.visual-paradigm.com/category/uml/page/6/

UML Archives – Visual Paradigm Guides

https://guides.visual-paradigm.com/category/uml/

Understanding Sequence Diagrams: A Comprehensive Guide – Visual Paradigm Guides

https://guides.visual-paradigm.com/understanding-sequence-diagrams-a-comprehensive-guide/

Creating Sequence Diagrams in UML: A Comprehensive Tutorial – Visual Paradigm Guides

https://guides.visual-paradigm.com/creating-sequence-diagrams-in-uml-a-comprehensive-tutorial/

Visual Modeling Archives – Page 3 of 4 – Visual Paradigm Guides

https://guides.visual-paradigm.com/category/visual-modeling/page/3/

Mastering MVC Architecture with the Sequence Diagram Refinement Tool

https://guides.visual-paradigm.com/mastering-mvc-architecture-with-the-sequence-diagram-refinement-tool/

Mastering the Art of UML Component Diagrams: A Guide to Software Architecture Modeling and Design – Visual Paradigm Guides

https://guides.visual-paradigm.com/mastering-the-art-of-uml-component-diagrams-a-guide-to-software-architecture-modeling-and-design/

Understanding UML Component Diagrams: A Comprehensive Guide – Visual Paradigm Blog

https://blog.visual-paradigm.com/understanding-uml-component-diagrams-a-comprehensive-guide/

UML Practical Guide – All you need to know about UML modeling

https://www.visual-paradigm.com/guide/uml-unified-modeling-language/uml-practical-guide/

Loading

Signing-in 3 seconds...

Signing-up 3 seconds...