 Visual Paradigm Desktop |
  Visual Paradigm Online


As a Product Owner, you sit at the intersection of business strategy and technical execution. You translate vision into actionable requirements, ensuring the team builds value efficiently. One of the most powerful tools in your arsenal for visualizing system behavior is the Use Case Diagram. While often associated with software engineers, these diagrams are vital for clarifying scope, identifying stakeholders, and preventing scope creep.
Many teams treat these diagrams as a heavy documentation burden. This is a mistake. When approached correctly, a Use Case Diagram acts as a single source of truth for functionality. It bridges the gap between abstract user needs and concrete system actions. This guide outlines a practical, streamlined approach to creating these diagrams without getting lost in theoretical complexities.
Product Owners manage a constant flow of requests. Without a clear visual representation, requirements can become fragmented. A Use Case Diagram provides a high-level map of the system. It answers critical questions early in the lifecycle:
By establishing these boundaries, you prevent the team from building features that fall outside the intended scope. It serves as a contract between the business and the development team. When disagreements arise regarding functionality, the diagram provides an objective reference point.
Furthermore, this visualization aids in stakeholder communication. Executives and clients often struggle to understand technical jargon. A diagram simplifies the narrative. It shows the flow of interaction without requiring deep knowledge of code architecture. This clarity accelerates decision-making and reduces the time spent in repetitive clarification meetings.
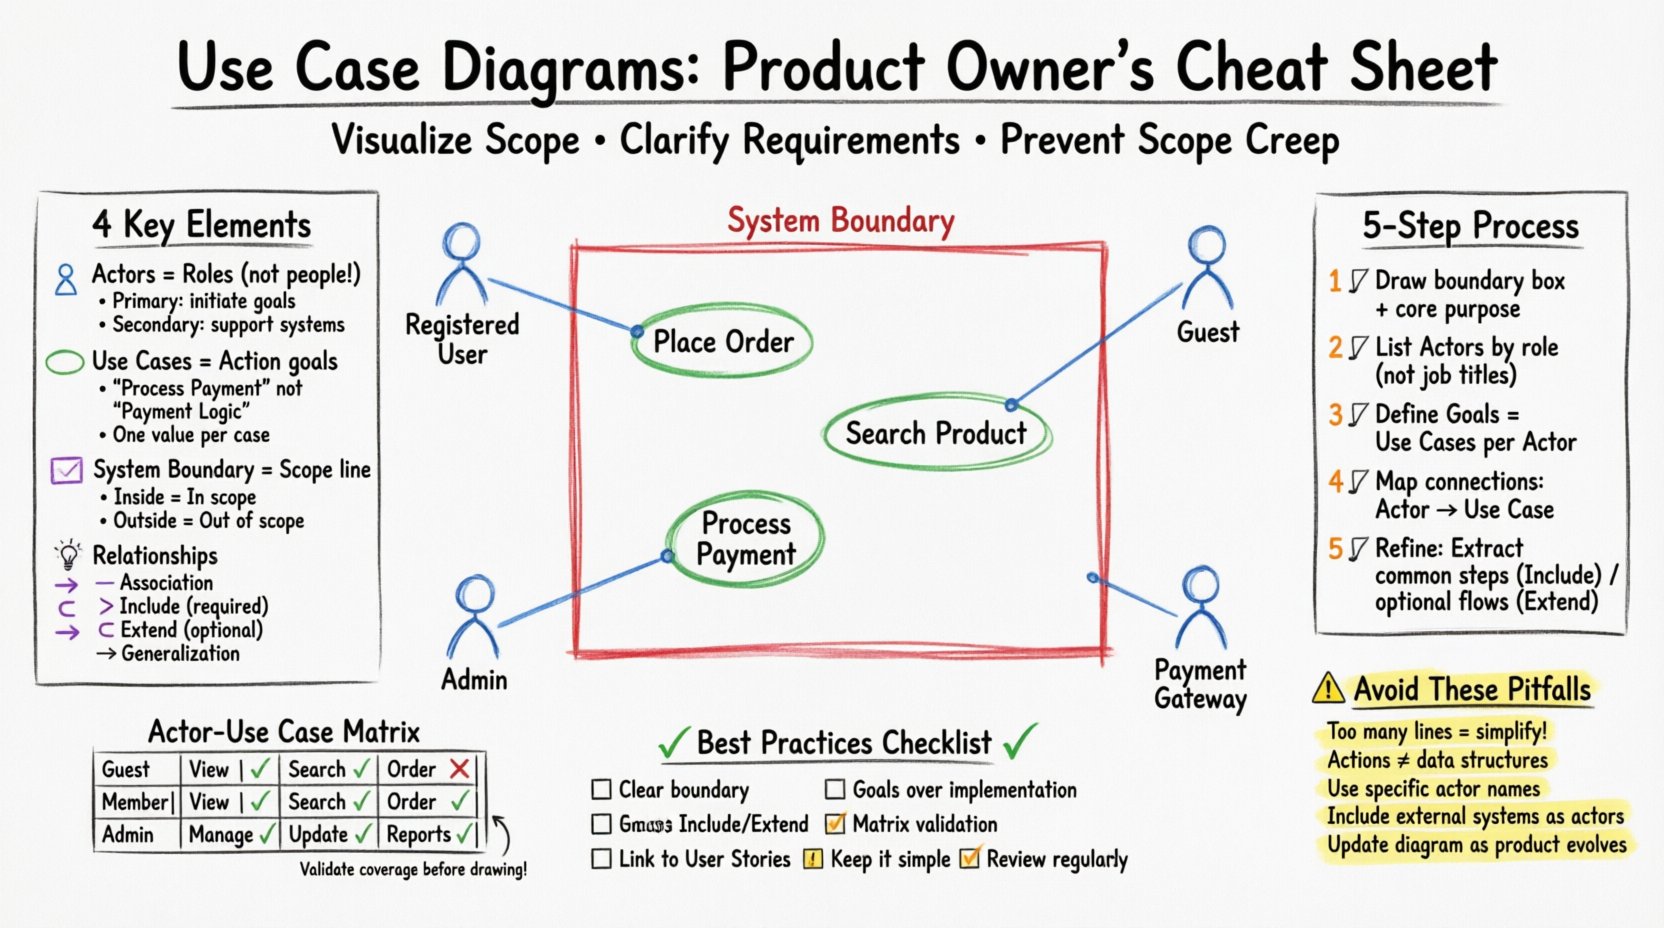
To build an effective diagram, you must understand its fundamental components. Think of these as the building blocks of your visual requirement specification. There are four main elements you will encounter repeatedly.
An Actor represents a role played by a user or an external system that interacts with the primary system. It is crucial to remember that an Actor is not a specific person; it is a role. For example, “Customer” is an Actor, not “John Smith”.
A Use Case represents a specific function or goal the system performs for an Actor. It describes what the system does, not how it does it. Each use case should be a distinct, valuable unit of functionality.
The System Boundary is a box that defines the scope of the software. Everything inside the box is part of the system. Everything outside is external. This is perhaps the most critical element for a Product Owner.
Lines connect Actors to Use Cases and Use Cases to other Use Cases. These lines define how the elements interact. There are three primary relationship types you need to manage.
Creating a diagram from scratch can feel overwhelming. To streamline this, follow a structured workflow. This method ensures you capture all necessary requirements without getting bogged down in details.
Start by drawing a simple box. Label it with the name of the application or module you are defining. This box represents the System Boundary. Write down the core purpose of the system next to it. This anchors the diagram and keeps the team focused.
Gather your stakeholders. Ask them who uses the system. Categorize them into Primary and Secondary actors. Avoid listing specific job titles if possible; focus on the role they play within the software context.
For each Actor, ask what they want to achieve. These goals become your Use Cases. Ensure there is a clear benefit to the Actor for every use case identified. If a Use Case provides no value to anyone, it should be removed.
Draw lines connecting Actors to their corresponding Use Cases. Ensure every Actor has at least one connection. If an Actor has no use cases, they might be unnecessary for this specific system version.
Review the Use Cases for commonalities. If multiple use cases require the same sub-process (like “Authentication”), extract that into a separate Use Case and link it using an Include relationship. If a use case has optional steps (like “Apply Coupon”), link it using an Extend relationship.
Diagrams are visual, but tables are excellent for verification. A matrix helps ensure you have covered every combination of Actor and Use Case. This is particularly useful during backlog refinement.
Below is an example structure you can use to validate your requirements before drawing lines on a diagram.
| Actor | Use Case 1 | Use Case 2 | Use Case 3 | Notes |
|---|---|---|---|---|
| Guest User | View Catalog | Search Product | – | Cannot checkout without account |
| Registered User | View Catalog | Search Product | Place Order | Has saved payment methods |
| Admin | Manage Users | Update Inventory | View Reports | Requires elevated permissions |
| Payment Gateway | Process Transaction | – | – | External System |
Using a table allows you to spot gaps quickly. If a row is empty, that Actor might not be doing anything in that area. If a column is empty, that Use Case might not be accessible to anyone. This validation step saves hours of rework later.
While Use Case Diagrams provide the macro view, User Stories provide the micro view. They are complementary tools. A single Use Case often contains multiple User Stories.
When decomposing a Use Case into stories, follow these guidelines:
For example, if the Use Case is “Place Order,” the User Stories might be:
This linkage ensures that the detailed work aligns with the high-level visual plan. It prevents the team from drifting into features that do not support the core diagrammatic requirements.
Even experienced practitioners make mistakes when creating these diagrams. Being aware of common errors helps you maintain clarity and utility.
A diagram with hundreds of lines is useless. If your diagram looks like a tangled web, it is too detailed for a high-level overview. You should aim for a summary level. If a process is too complex, create a separate, detailed sequence diagram for that specific Use Case.
Do not draw boxes for databases or data tables inside the system boundary. Use Cases are actions, not data structures. The system might access data, but the diagram focuses on what the system does for the user.
Using names like “User” is too broad. Distinguish between “Anonymous Visitor,” “Registered Member,” and “Administrator.” Each has different permissions and interactions. Specificity reduces ambiguity in development.
Modern software rarely exists in a vacuum. You must represent external APIs, third-party services, or hardware devices as Secondary Actors. If a payment fails because the external bank is down, that is a system interaction that needs visibility.
A diagram is not a permanent artifact. Requirements change. You must be prepared to update the diagram as the product evolves. Treat it as a living document, not a one-time deliverable.
Creating the diagram is only half the battle. You must ensure it is understood and accepted by the team.
When stakeholders review the diagram, they often see the big picture. This is the moment to confirm that the business goals are met. If a stakeholder asks for a feature that is outside the boundary, you can point to the diagram and explain why it is out of scope for this iteration.
How do you know if your Use Case Diagrams are effective? Look for these indicators:
Software is dynamic. As you release updates, the diagram must evolve. Do not treat the diagram as a static requirement document.
Consistency is key. If you update the diagram, ensure the User Stories and Acceptance Criteria are updated simultaneously. This keeps the entire documentation set in sync.
To wrap up this guide, here is a quick checklist for your next session.
By following these principles, you can create diagrams that serve as a robust foundation for product development. You do not need years of experience to do this. You need a structured approach and a focus on clarity. With practice, you will be able to visualize system requirements quickly and effectively, allowing your team to focus on building value.
Remember, the goal is not to create perfect art. The goal is to create a tool that reduces risk and improves communication. Start small, iterate often, and let the diagram guide your product vision.