 Visual Paradigm Desktop |
  Visual Paradigm Online


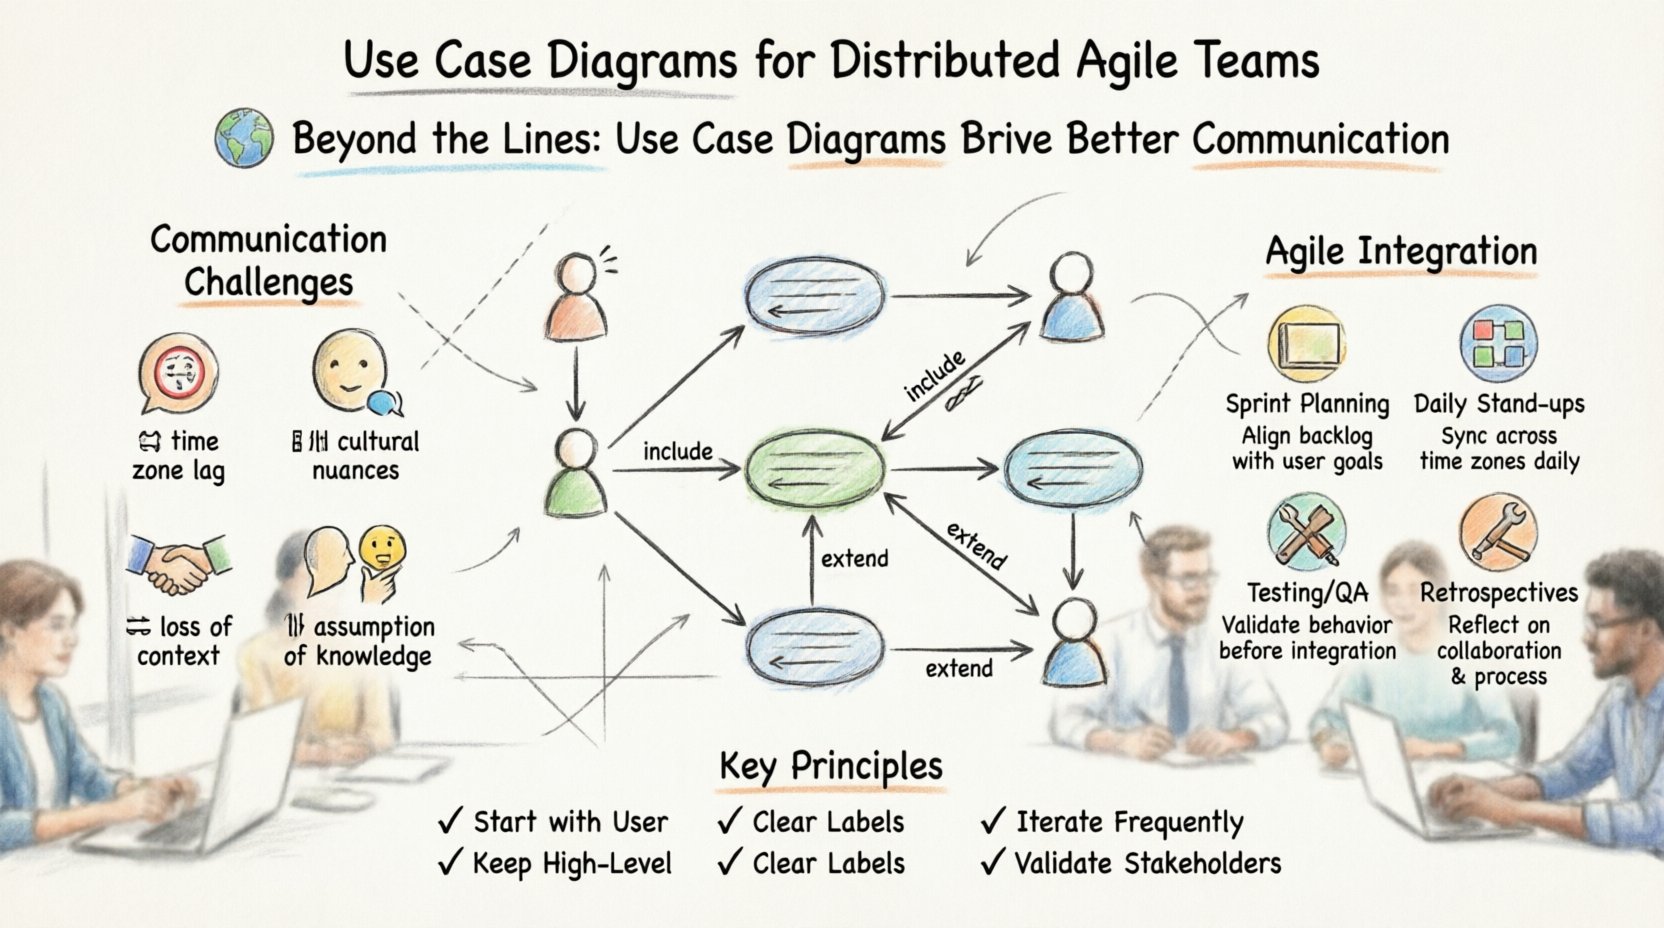
In the modern landscape of software development, geographical boundaries are increasingly irrelevant. Teams are distributed across time zones, cultures, and languages. 🌍 While this distribution brings diverse perspectives, it also introduces significant friction into the communication process. Misunderstandings regarding requirements can cascade into costly rework, delayed sprints, and fractured team morale. To navigate this complexity, visual artifacts become more than just documentation; they become the shared language of the team.
Among the various modeling techniques available, the Use Case Diagram stands out as a foundational tool for aligning stakeholder expectations and technical implementation. When utilized correctly, it bridges the gap between abstract business goals and concrete system behaviors. This guide explores how distributed Agile teams can leverage these diagrams to enhance clarity, reduce ambiguity, and foster a cohesive development environment. 🚀
A Use Case Diagram is a visual representation of the functional requirements of a system. It focuses on the interactions between external entities and the system itself. Unlike detailed sequence diagrams or class diagrams, which dive deep into implementation logic, use case diagrams operate at a higher level of abstraction. This abstraction is crucial for Agile teams, where the focus remains on delivering value rather than getting bogged down in premature technical details. 🎯
The diagram consists of three primary elements:
In a distributed environment, where face-to-face clarification is impossible, these visual elements serve as the anchor for discussions. They prevent the “telephone game” scenario where a requirement is passed from a stakeholder in one country to a developer in another and becomes distorted along the way. 🛡️
Agile methodologies thrive on direct communication. The Agile Manifesto values individuals and interactions over processes and tools. However, when a team is distributed, this direct interaction is often mediated by digital channels. 📱
Text-based communication, such as emails, chat messages, or ticket descriptions, often lacks the nuance of tone and context. A sentence written in a backlog item can be interpreted in multiple ways. One developer might see a button placement as a UI detail, while another sees it as a core workflow trigger. Without a shared visual reference, these interpretations diverge.
Consider the following common scenarios where communication breaks down:
These friction points lead to technical debt. Code is written based on assumptions, which are later proven incorrect, requiring refactoring. This cycle drains velocity and frustrates the team. Visual modeling acts as a contract. When everyone agrees on the diagram, the code written against it is less likely to deviate from the intended behavior.
Use Case Diagrams provide a specific type of value in distributed settings: they are language-agnostic. While the text describing a feature might be in English, the diagram transcends language barriers. A stick figure connecting to a circle is universally understood as “User does Action.” This universality is critical for teams spanning different linguistic backgrounds. 🌐
Furthermore, use case diagrams force a focus on what the system does, not how it does it. In distributed teams, debating implementation details over video calls can lead to endless loops of technical argumentation. By agreeing on the use cases first, the team aligns on the scope. The implementation details can then be discussed asynchronously or within specific technical workshops without derailing the broader scope. 🧱
This separation of concerns allows for better parallel work. One team can focus on the authentication use case while another works on the payment processing use case. As long as the boundaries defined in the diagram are clear, the teams can work independently and integrate later with fewer conflicts. 🤝
Creating a diagram is not just about drawing shapes. It requires a disciplined approach to ensure the artifact remains useful throughout the project lifecycle. A diagram that is too complex becomes a wall of text on a screen. A diagram that is too simple fails to capture necessary constraints. 🎨
Follow these principles to ensure high-quality diagrams:
When working remotely, the creation process should be collaborative. Instead of one person drawing and sending a file, use a shared whiteboard or collaborative modeling tool. This allows stakeholders to move elements around in real-time, ensuring everyone feels ownership of the design. 🖊️
In Agile, documentation is often viewed with skepticism. The mantra is “working software over comprehensive documentation.” However, this does not mean documentation is unnecessary. It means documentation must be lightweight and valuable. Use Case Diagrams fit this criteria perfectly when integrated correctly. ⚙️
Here is how to weave these diagrams into standard Agile ceremonies:
During planning, the team selects items from the backlog. The use case diagram serves as the map for these items. If a user story is vague, the team refers to the diagram to understand the boundary of the work. “Does this story fall under the ‘Export Data’ use case or the ‘Archive Data’ use case?” This question resolves ambiguity instantly. 🗺️
While the diagram is not updated daily, it is referenced. If a developer is blocked on a requirement, they can ask, “Is this part of the ‘User Profile’ use case?” If the answer is no, it indicates a scope creep issue that needs addressing. 🚧
Test cases should be derived directly from use cases. Every use case should have at least one test scenario. In a distributed team, QA engineers often work in different time zones than developers. The diagram serves as the source of truth for what needs to be tested. It ensures that the QA team is validating the right behaviors, not just the UI elements. 🧪
If a misunderstanding occurred during the sprint, the retrospective should examine the diagram. Was the diagram unclear? Was it missing an actor? Did the team ignore the diagram? These insights lead to process improvements. 🛠️
Implementing this practice is not without its hurdles. It requires discipline and cultural buy-in. The following table outlines the trade-offs teams will encounter.
| Aspect | Benefit | Challenge |
|---|---|---|
| Clarity | Visuals reduce ambiguity significantly compared to text. 🧐 | Creating accurate diagrams requires time and skill. ⏳ |
| Alignment | Stakeholders and developers agree on scope before coding. 🤝 | Stakeholders may find technical diagrams difficult to read. 🤷 |
| Maintenance | Diagrams highlight outdated features quickly. 🕵️♂️ | Diagrams often fall out of sync if not updated regularly. 📉 |
| Onboarding | New hires can understand system flow quickly. 🎓 | Initial creation cost is higher than writing code. 💸 |
| Communication | Reduces reliance on synchronous meetings. 📞 | Requires a shared tool or platform for remote access. 💻 |
Even with good intentions, teams often misuse use case diagrams. Recognizing these pitfalls helps maintain the integrity of the modeling process.
To truly leverage the power of use case diagrams, teams must understand the relationships between use cases. Two specific relationships are critical for managing complexity: Include and Extend.
The Include relationship indicates that one use case necessarily incorporates the behavior of another. For example, a “Place Order” use case might include a “Validate Payment” use case. This ensures that the validation logic is reused and not duplicated in other flows. It promotes consistency across the system. 🔄
The Extend relationship indicates optional behavior. A “Place Order” use case might be extended by a “Apply Coupon” use case. The coupon is not required, but it modifies the behavior if present. This helps in visualizing variations without cluttering the main flow. 🎁
Using these relationships correctly reduces the number of lines on the diagram. Instead of drawing the same “Login” actor to every use case, you can define “Login” once and link it to a central flow. This keeps the diagram clean and readable, which is essential for remote teams reviewing it on small screens. 📱
Tools and techniques are only half the battle. The other half is culture. Distributed teams must actively encourage visual thinking. This means normalizing the use of diagrams in chat channels and documentation. 📢
When a developer posts a question in a chat, they should include a snippet of the diagram if it helps explain the context. When a designer mocks up a screen, they should reference the corresponding use case. This creates a web of connections that makes the system understandable to everyone. 🕸️
Training is also essential. Not every developer knows how to read a UML diagram. Invest time in workshops where team members practice drawing and reading these diagrams together. This shared skill set creates a common vocabulary. 🗣️
Furthermore, leadership must support this effort. If management prioritizes speed over documentation, the team will stop drawing diagrams. If management values clarity and reduces rework, the team will continue. Align incentives to ensure the diagrams remain a priority. 🏆
For regulated industries, use case diagrams can serve as part of the compliance documentation. They demonstrate that the system has been designed to handle specific user roles and data flows. In a distributed team, where audit trails are crucial, these diagrams provide a snapshot of the system’s architecture at a specific point in time. 📜
They also help identify security gaps. If a use case allows a user to access sensitive data without an actor labeled “Admin” or “Security Check,” it flags a potential vulnerability. Visual inspection is often faster than code review for spotting logical security errors. 🔐
Distributed Agile teams face unique challenges in communication and alignment. The distance between team members can create silos of knowledge and misunderstandings that slow down progress. Use Case Diagrams offer a robust solution to these problems. They provide a shared visual language that transcends text, time zones, and technical jargon.
By focusing on the user’s goals rather than the system’s implementation details, these diagrams keep the team aligned on the “what” and the “why.” They integrate seamlessly into Agile ceremonies, supporting planning, testing, and maintenance. While they require discipline to maintain, the return on investment is a team that moves faster, with fewer errors, and greater confidence in their product. 🏗️
Start small. Pick one complex feature and map it out. Invite the team to critique it. Watch how the conversations change. The lines on the page may be simple, but the clarity they bring is profound. 📈