 Visual Paradigm Desktop |
  Visual Paradigm Online


In the complex landscape of system development, few challenges are as persistent as the gap between what stakeholders imagine and what engineers build. This disconnect often leads to costly rework, delayed timelines, and frustrated teams. One of the most effective tools for bridging this divide is the use case diagram. While often relegated to the background of technical documentation, this visual artifact possesses significant potential for aligning expectations before a single line of code is written. By focusing on user goals and system interactions, teams can secure agreement on the scope and functionality early. This approach reduces ambiguity and fosters a shared understanding among business owners, developers, and testers alike.
Effective communication is not just about sharing information; it is about ensuring comprehension. Technical specifications can be dense and abstract, often failing to resonate with non-technical participants. A well-constructed diagram simplifies this complexity, translating functional requirements into a visual language that is accessible to everyone involved. This guide explores how to leverage this notation to foster collaboration, validate requirements, and streamline the delivery process without relying on specific tools or vendors.
A use case diagram is a behavioral view of a system. It captures the interactions between users, or actors, and the system itself. Unlike data models which focus on structure, or sequence diagrams which focus on timing, use case diagrams focus on what the system does from the perspective of an external entity. This distinction is critical for stakeholder engagement because it speaks directly to value and functionality rather than implementation details.
When stakeholders see their specific roles represented as actors, they immediately recognize their place in the ecosystem. This recognition is the first step toward ownership. They are no longer passive observers of a technical document; they are active participants in the design conversation. This visual representation acts as a contract of sorts, defining the boundaries of responsibility and capability.
Project failure often stems not from technical debt, but from requirement ambiguity. When stakeholders have different mental models of the system, the resulting product rarely satisfies everyone. Misalignment can manifest in various ways:
Addressing these issues requires a mechanism for early validation. Textual requirements are often open to interpretation. A sentence like “The system shall process orders” can mean different things to a salesperson, a warehouse manager, and a developer. A diagram forces specificity. It requires defining the trigger, the action, and the outcome. This clarity reduces the risk of assumptions and ensures that all parties are working from the same source of truth.
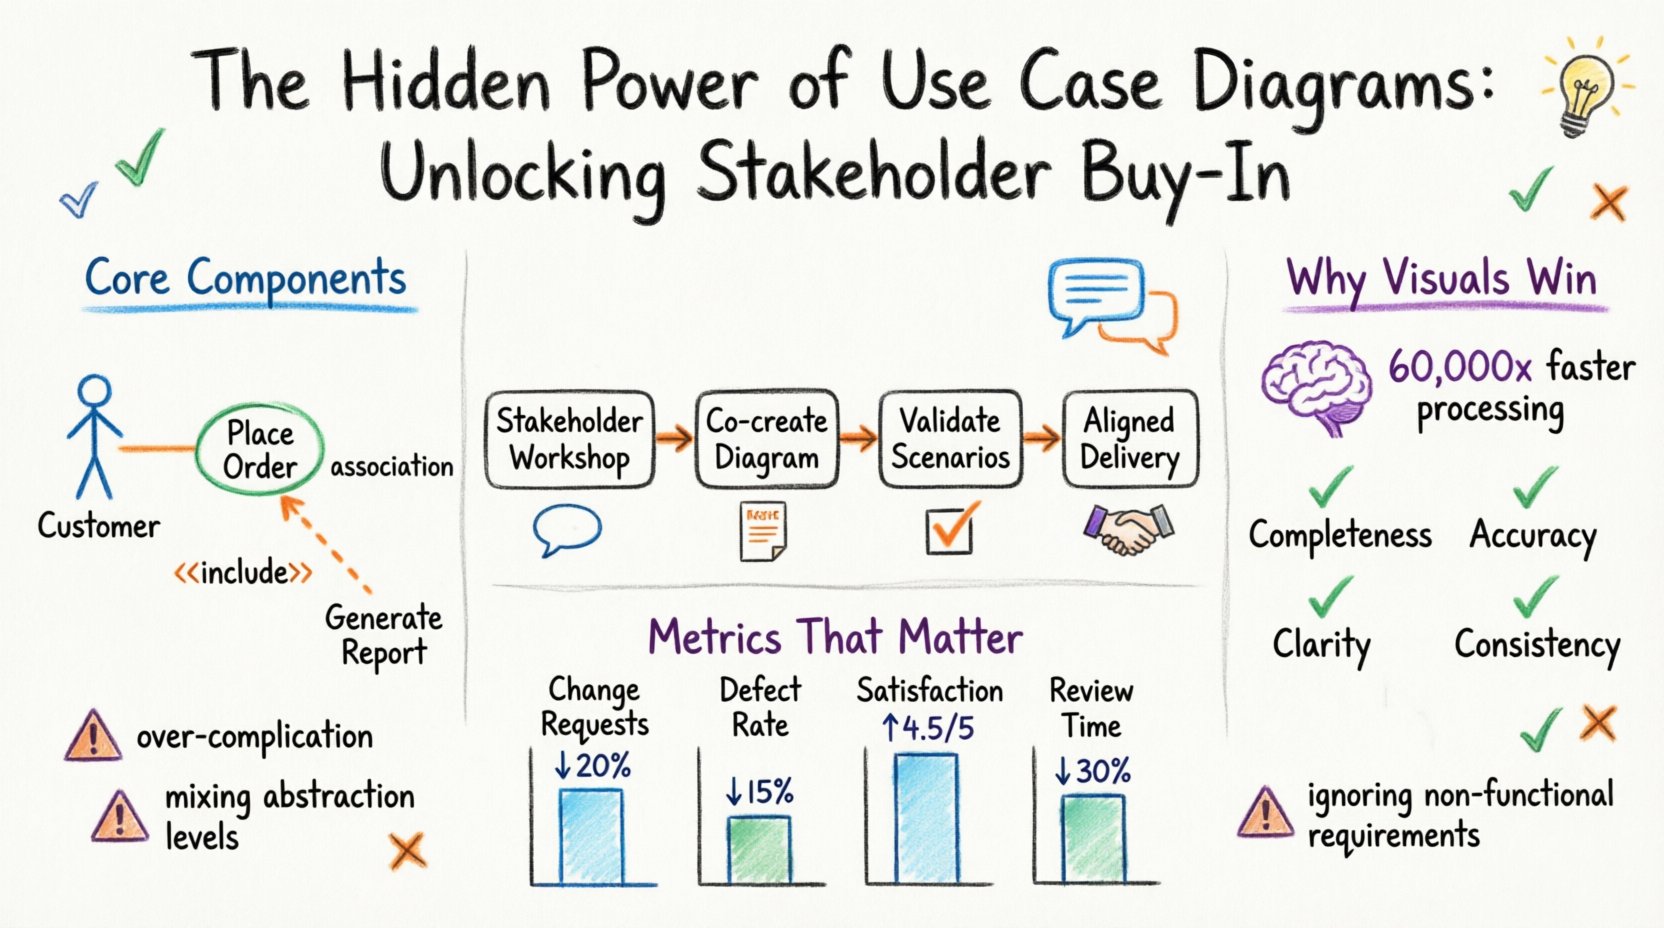
The human brain processes visual information significantly faster than text. Studies suggest that visual processing is roughly 60,000 times faster than text processing. In a business context, this speed translates to efficiency during meetings and workshops. When a diagram is presented, stakeholders can identify issues or missing elements almost instantly. This immediacy allows for real-time corrections, whereas reviewing a text document might require days of cross-referencing.
Furthermore, visual artifacts serve as a focal point for discussion. Instead of reading a wall of text, participants can point to specific nodes and ask, “What happens if this actor performs this action here?” This interactive quality turns a documentation review into a collaborative problem-solving session. It shifts the dynamic from passive consumption to active exploration.
To create a diagram that effectively communicates with stakeholders, one must understand the fundamental building blocks. Each element serves a specific purpose in defining the system’s behavior. Clarity in these components prevents confusion later in the project lifecycle.
An actor represents a role played by a user or an external system. It is crucial to distinguish between the role and the individual. For example, a “Manager” is a role, not a specific person named John. This abstraction allows the diagram to remain relevant even if personnel change.
A use case is an oval shape representing a specific function or goal. It describes a complete unit of functionality. It should be named using a verb-object phrase, such as “Place Order” or “Generate Report”.
Relationships define how actors and use cases interact. Understanding these lines is key to interpreting the diagram correctly.
Creating the diagram is a collaborative effort. It should not be drafted in isolation by an analyst. Instead, it requires a facilitated session with key stakeholders. The goal is to co-create the model, ensuring that everyone contributes their perspective.
Before the meeting, gather existing documentation, process maps, and interview notes. Prepare a blank canvas or a whiteboard space. Define the scope of the session clearly. Are you modeling the entire system, or just a specific module? Setting boundaries prevents the discussion from spiraling out of control.
Start with the high-level actors. Ask stakeholders to identify who interacts with the system. Then, move to the goals. For each actor, ask what they are trying to accomplish. Record these as use cases.
Once the draft diagram is complete, validation is essential. This step confirms that the model accurately reflects the business needs. Validation is not just a signature on a document; it is a walkthrough of scenarios.
Consider the following validation checklist:
During the walkthrough, walk through specific scenarios. “If the Customer logs in, what happens next?” “What if the Payment Gateway fails?” This stress-testing of the diagram reveals gaps in logic or missing error handling paths that were not initially considered.
Even experienced practitioners can fall into traps that reduce the effectiveness of use case diagrams. Being aware of these common errors helps maintain the quality of the model.
A common mistake is trying to capture every single detail in the diagram. This leads to a cluttered mess that is difficult to read. Use case diagrams should provide a high-level overview. Detailed logic belongs in use case descriptions or user stories, not in the diagram itself.
While use case diagrams focus on functionality, non-functional requirements (performance, security, reliability) are equally important. These should be noted separately or included as annotations, but not confused with behavioral use cases.
Do not mix high-level business processes with low-level system operations in the same diagram. Keep business-level actors separate from technical system actors. Mixing them confuses the audience and dilutes the focus.
A diagram is a snapshot. It does not capture the full flow of time or state changes. Do not rely on the diagram alone to understand the sequence of events. Use sequence diagrams or process flows to complement the use case model when timing matters.
Use case diagrams are not limited to traditional waterfall approaches. They are equally valuable in agile environments. In agile, they serve as a foundation for user stories.
How do you know if using use case diagrams is improving your process? Track specific metrics over time. While qualitative feedback is valuable, quantitative data provides proof of concept.
| Metric | Description | Target |
|---|---|---|
| Change Request Volume | Number of scope changes after sign-off | Decrease by 20% |
| Defect Rate | Bugs related to misunderstood requirements | Decrease by 15% |
| Stakeholder Satisfaction | Survey scores regarding clarity | Increase to 4.5/5 |
| Review Time | Time taken to review requirements | Reduce by 30% |
Tracking these metrics helps demonstrate the return on investment for the time spent creating the diagrams. It justifies the effort to management and encourages continued adoption of the practice.
The creation of a use case diagram is more than a technical exercise; it is a strategic communication tool. It transforms abstract needs into concrete visual plans. By focusing on the actors and their goals, teams can ensure that the final system delivers real value. The early involvement of stakeholders through this method builds trust and reduces friction down the road.
Success in system analysis depends on clarity and agreement. When everyone understands the boundaries and behaviors of the system, the path to delivery becomes smoother. Embrace the diagram as a living artifact that evolves with the project. Use it to guide discussions, validate assumptions, and align expectations. This disciplined approach to requirements engineering pays dividends in the quality of the final product and the satisfaction of the team.
Remember that the goal is not perfection in the first draft. The goal is alignment. A simple diagram that everyone agrees on is far more valuable than a complex one that confuses the room. Prioritize understanding over detail, and collaboration over isolation. These principles will serve as the foundation for successful projects in any environment.