 Visual Paradigm Desktop |
  Visual Paradigm Online


In the fast-paced environment of agile development, aligning high-level requirements with immediate execution goals is a persistent challenge. Teams often find themselves drowning in a backlog of user stories that lack context or clear prioritization. This is where the visual clarity of a use case diagram becomes an invaluable asset. By mapping out interactions between actors and the system, teams can gain a structured view of value delivery. This guide explores how to leverage these diagrams to prioritize features effectively during sprint planning sessions.
Many organizations struggle with the disconnect between strategic roadmaps and tactical execution. A backlog filled with hundreds of items can lead to decision fatigue. Stakeholders may demand features that seem critical but do not align with core user needs. Conversely, developers might build technical debt under the guise of “nice-to-haves.” A use case diagram provides a neutral ground. It visualizes the “what” and the “who” without getting bogged down in the “how” immediately. This separation allows product owners and teams to focus on value and necessity.
When integrated correctly, this modeling technique transforms abstract requests into actionable items. It forces a conversation about boundaries and responsibilities. It clarifies which features are mandatory for the system to function and which are enhancements. This clarity is the bedrock of effective sprint planning. By understanding the ecosystem of interactions, teams can sequence their work logically. This reduces rework and ensures that every sprint contributes meaningfully to the product vision.
Before diving into prioritization, it is essential to establish a shared understanding of the tool at hand. A use case diagram is a behavioral view of the system. It represents the system’s functionality as a set of use cases. These use cases are identified from the perspective of external actors. An actor represents a role that interacts with the system, such as a customer, administrator, or third-party service.
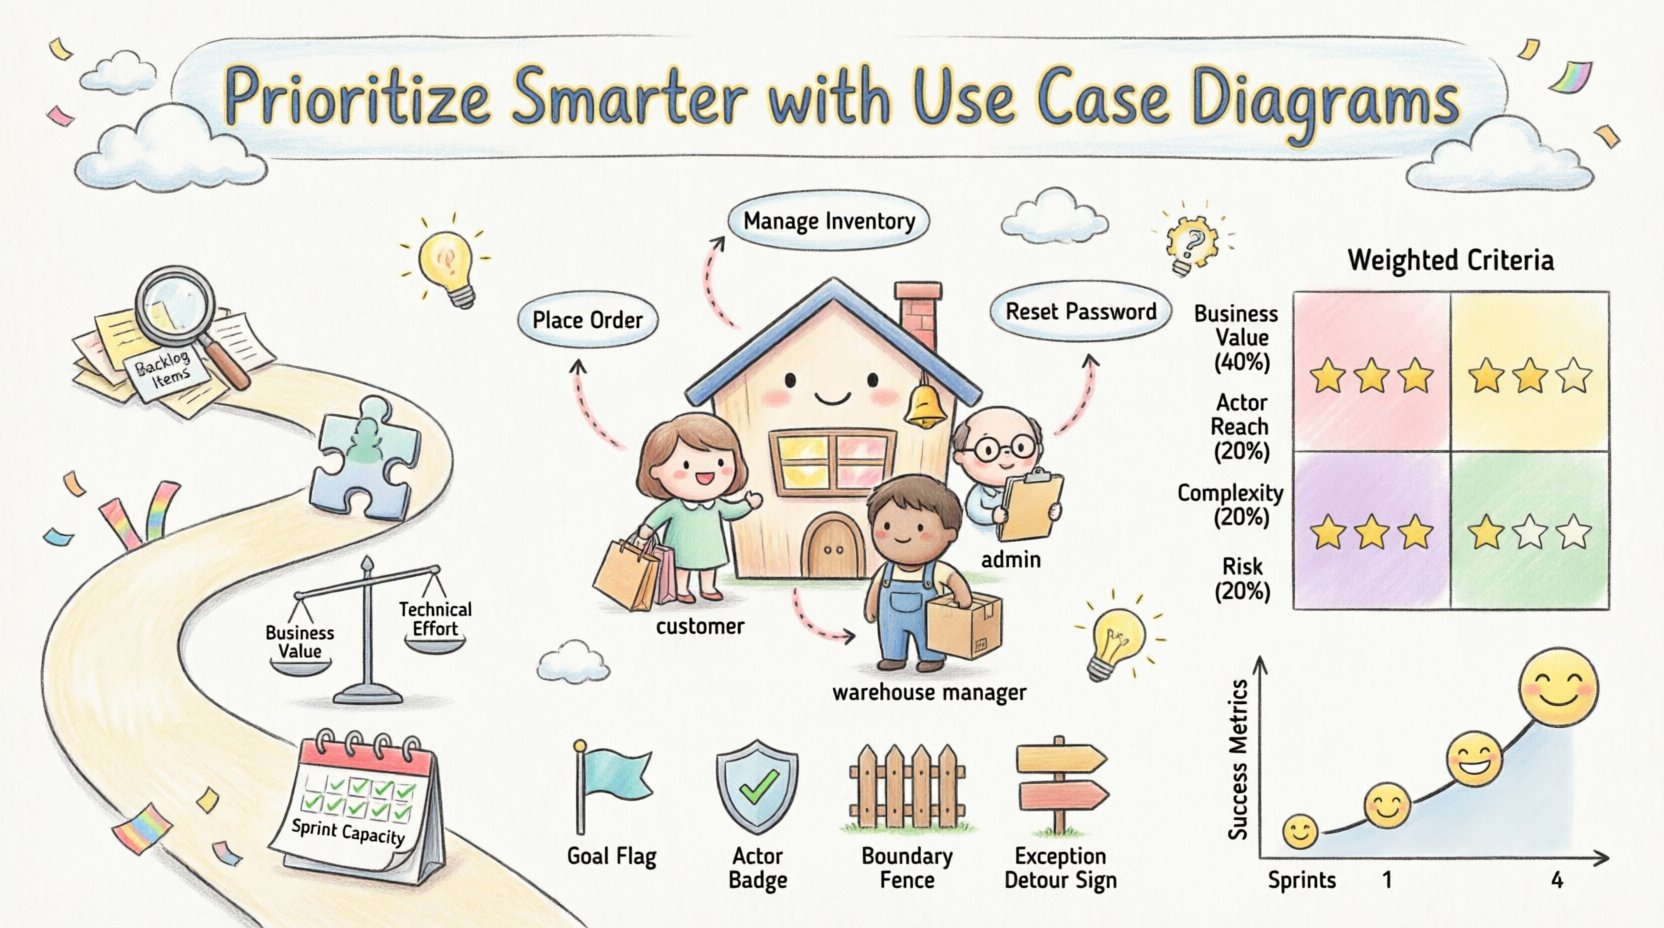
The diagram is not a technical blueprint. It does not show database tables or API endpoints. Instead, it focuses on goals. Each use case represents a goal that an actor wants to achieve. For example, “Place Order” is a goal for a “Customer” actor. “Manage Inventory” is a goal for a “Warehouse Manager” actor. By defining these goals explicitly, the team creates a map of value.
Key components include:
When creating these diagrams, precision matters. Vague labels lead to vague planning. Instead of “View Data,” use “View Customer Order History.” This specificity allows for better estimation later. It also helps in identifying overlaps. If two actors have the same goal, the team can consolidate features. This reduces redundancy and streamlines the backlog.
Sprint planning is a time-boxed event. The goal is to select a subset of the backlog to complete in the upcoming iteration. Time is limited. Capacity is finite. The pressure to deliver is high. Without a clear prioritization framework, teams often fall into the trap of choosing the easiest items rather than the most valuable ones. This is known as “low-hanging fruit syndrome.”
Another common issue is the lack of context. A user story might say “As a user, I want to reset my password.” But it does not explain the security implications or the integration with identity management. A use case diagram reveals these dependencies. It shows if the “Reset Password” use case relies on an “Email Service” actor. If that service is unstable, the feature becomes high risk. This insight is crucial for sprint selection.
Furthermore, stakeholders often speak in features, while developers speak in tasks. The use case diagram acts as a translator. It bridges the gap between business language and technical implementation. It ensures that the features selected for the sprint actually solve the user’s problem. It prevents the team from building features that no one uses. This alignment is the key to successful delivery.
Integrating visual models into agile ceremonies requires a deliberate approach. It is not enough to draw a diagram once and file it away. The diagram must be a living document that guides decision-making. Here is a practical workflow for incorporating use case analysis into your sprint cycle.
Start by reviewing your existing backlog. Many user stories are derived from underlying use cases. Map each story back to its parent use case. If multiple stories belong to one use case, group them. This creates a hierarchical view. It shows the scope of the feature before breaking it down. This step prevents scope creep during the sprint.
Analyze the actors associated with each use case. Are there external dependencies? For instance, does the “Checkout” use case require a “Payment Gateway” actor? If the payment gateway is a third-party service, its stability affects your sprint risk. Map these relationships. This helps in identifying bottlenecks before they become blockers.
Use the diagram to facilitate a discussion on value. High-value use cases should be prioritized. Value can be measured by the number of actors involved or the criticality of the goal. A use case used by all actors is more critical than one used by a niche group. Simultaneously, assess the technical effort. Complex relationships, such as extensions or inclusions, often imply higher effort. Plot these findings to visualize the trade-offs.
Review the sprint capacity. Can the team complete the high-value use cases within the timebox? If not, decompose the use case. Break it down into smaller, manageable use cases or user stories. Ensure that the decomposition respects the integrity of the goal. Do not split a goal so thinly that it loses its meaning. The diagram serves as a sanity check for feasibility.
To make objective decisions, teams often benefit from a scoring matrix. This tool removes bias from the prioritization process. It forces the team to evaluate features based on agreed-upon criteria. When combined with use case data, the matrix becomes a powerful decision-making engine.
| Criteria | Definition | Scoring (1-5) | Weight |
|---|---|---|---|
| Business Value | How much does this use case contribute to revenue or user satisfaction? | 1 = Low, 5 = High | 40% |
| Actor Reach | How many distinct actors interact with this use case? | 1 = Single Actor, 5 = All Actors | 20% |
| Complexity | How many dependencies or extensions are involved? | 1 = Simple, 5 = Highly Complex | 20% |
| Risk | What is the potential impact of failure? | 1 = Low Risk, 5 = Critical Failure | 20% |
Using this table, the team can calculate a priority score for each use case. For example, a use case with high business value and high actor reach will score higher than a niche feature. However, if the complexity is too high, the score might be adjusted downward. This balanced approach ensures that the sprint is neither too risky nor too easy.
Once the use cases are prioritized, the next step is to translate them into user stories. This is where the diagram informs the acceptance criteria. A use case defines the success condition. A user story defines the user’s perspective. The two must align perfectly.
When writing a user story, reference the specific use case ID. This creates traceability. If a story fails testing, the team can trace it back to the use case requirement. This makes debugging faster. It also helps in regression testing. If a use case is modified, all related stories must be reviewed.
Here is a checklist for mapping:
By following this process, the team ensures that every story is grounded in a validated requirement. This reduces the chance of building the wrong thing. It also makes the sprint review more meaningful. Stakeholders can see the use case progress, not just the story completion.
Even with a solid framework, teams encounter hurdles. Recognizing these pitfalls early can save significant time. Below are common issues and how to address them.
It is easy to spend too much time perfecting the visual model. The goal is clarity, not art. Avoid excessive detail. Do not diagram every single method call or database query. Keep it at the functional level. If the diagram takes more than a sprint to update, it is too complex. Simplify the notation.
While use cases focus on the “what,” developers need to know the “how.” Do not use the diagram as an excuse to avoid technical discussions. The diagram should be the starting point, not the end. Ensure that technical spikes are included in the sprint to explore implementation details.
A diagram drawn at the start of the project becomes obsolete quickly. If the backlog changes, the diagram must change. Assign a product owner to maintain the model. Review it during sprint retrospectives. If a feature is deprioritized, remove it from the diagram. Keep the visual model synchronized with reality.
If stakeholders do not understand the diagram, it will not help them. Use it as a communication tool in meetings. Walk them through the actors and goals. Ask them to validate the relationships. If they disagree, update the model. Their feedback is the key to accurate prioritization.
How do you know if this approach is working? You need metrics. Traditional velocity metrics may not capture the value of better alignment. Consider tracking the following indicators over time.
These metrics provide feedback. They help the team refine their process. If requirement churn remains high, revisit the diagramming process. If stakeholder satisfaction is low, re-evaluate the actor definitions. Continuous improvement is essential for long-term success.
Incorporating use case diagrams into sprint planning is not about adding bureaucracy. It is about adding clarity. It shifts the focus from output to outcome. By understanding the interactions and goals, teams can make smarter decisions. They can prioritize features that truly matter.
This approach requires discipline. It requires the team to resist the urge to skip the modeling step. But the return on investment is significant. Reduced rework, better alignment, and happier stakeholders are the results. In a world of complex systems, visual models remain one of the most effective tools for communication.
Start small. Pick one upcoming sprint. Draft a diagram for the top ten backlog items. Discuss it with the team. Adjust based on the feedback. Over time, this practice will become second nature. It will become a standard part of your agile toolkit. The path to efficient development is paved with clear requirements. Use case diagrams are the paving stones.
Remember, the goal is not to create a perfect document. The goal is to facilitate a conversation. Use the diagram to ask the right questions. Challenge assumptions. Validate risks. When the team moves forward with this shared understanding, the likelihood of success increases. Prioritization becomes less of a guess and more of a calculated strategy.