 Visual Paradigm Desktop |
  Visual Paradigm Online


As a Product Owner, you sit at the intersection of business needs and technical execution. One of the most persistent challenges is translating complex requirements into a visual format that developers and stakeholders can agree upon. Use Case Diagrams have long been a staple in systems analysis, yet their practical application often sparks debate. Why are they necessary? When should they be created? How do they fit into modern development cycles?
This guide addresses the fifteen most common questions Product Owners encounter regarding Use Case Diagrams. We will explore the mechanics of actors, boundaries, and relationships without relying on specific tools or hype. The goal is to provide clarity on how these diagrams function as a communication bridge rather than just documentation.
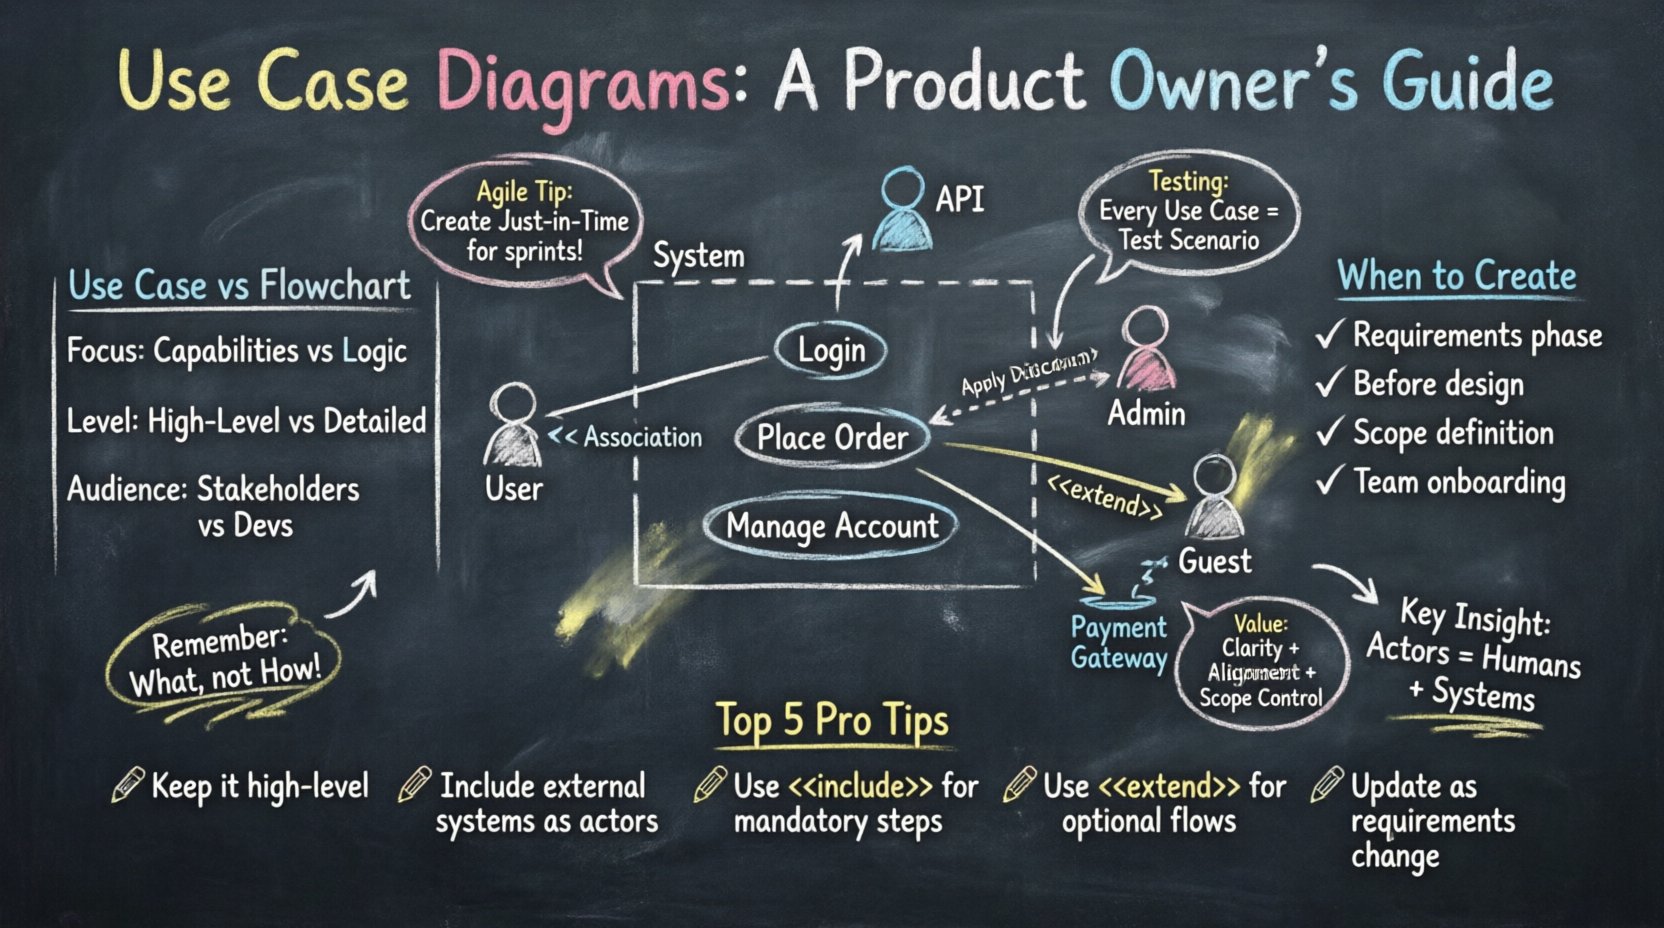
A Use Case Diagram is a behavioral model that illustrates the interactions between external entities and the system being designed. It focuses on what the system does from the perspective of the user, rather than how it does it internally.
Unlike a flowchart that details the sequence of steps, a Use Case Diagram remains high-level. It provides a snapshot of the capabilities available to different users. For a Product Owner, this diagram serves as a shared vocabulary to discuss features before diving into detailed specifications.
Confusion often arises regarding who counts as an actor. An actor represents any role that interacts with the system. It is not limited to human beings.
Human Actors:
System Actors:
Identifying the correct actors ensures that no critical interaction is overlooked. If a third-party service triggers an action within your product, that service is an actor. Mapping these interactions early prevents integration gaps during development.
While both diagrams visualize processes, they serve different audiences and purposes. A flowchart is a procedural guide showing the logic flow, decisions, and outcomes of a specific task.
Comparison:
| Feature | Use Case Diagram | Flowchart |
|---|---|---|
| Focus | Functional Capabilities | Process Logic |
| Level | High-Level Overview | Detailed Step-by-Step |
| Users | Stakeholders & Developers | Developers & QA |
| Complexity | Simplified | Complex Logic |
Use Case Diagrams answer “What can I do?” whereas flowcharts answer “How does this specific action work?”. Product Owners should prioritize Use Case Diagrams for requirement gathering and flowcharts for implementation details.
These two artifacts often coexist in modern agile environments, but they are not identical. A Use Case is a structured description of a goal-oriented interaction. A User Story is a lightweight requirement written from the user’s perspective.
A single Use Case might encompass multiple User Stories. For example, a Use Case for “Manage Account” could break down into stories for “Change Password,” “Update Email,” and “Delete Account.” Using Use Cases helps organize stories into logical functional groups.
Timing is critical. Creating this diagram too late reduces its value as a communication tool. Creating it too early may waste effort on details that change.
Optimal Timing:
It is most effective during the discovery phase of a release. Once the development sprint is well underway, the diagram serves less as a planning tool and more as a reference guide.
The boundary is the box that separates the system from the outside world. Everything inside the box is part of the system; everything outside is the environment.
Defining the Box:
Be careful not to include internal implementation details inside the box. The boundary should represent the system’s public interface. If a database is internal, it stays inside. If a payment processor is external, it stays outside.
Understanding relationships is crucial for modeling complexity without clutter. There are three primary types of relationships in this modeling standard.
Using these relationships correctly prevents redundancy. If a step happens every time, use Include. If it happens sometimes, use Extend.
Generalization allows you to model inheritance among actors or use cases. It reduces complexity by grouping similar behaviors.
This hierarchy helps Product Owners visualize permission structures and feature tiers. It clarifies which users have access to which functions without drawing duplicate lines for every specific role.
Not all diagrams need to show every single click. The level of detail depends on the audience.
High-Level:
Detailed:
A Product Owner should maintain both. The high-level view keeps the team aligned on the vision, while the detailed view aids in technical planning.
Traditional diagrams often focus on success paths. However, systems must handle errors gracefully. Negative flows represent scenarios where the system cannot complete the action.
Common Negative Scenarios:
While you do not need a separate diagram for every error, you should note them in the description of the use case. The diagram itself remains clean, but the textual specification clarifies how the system responds when things go wrong. This distinction keeps the visual model readable while ensuring requirements are complete.
Yes, but it requires adaptation. In traditional waterfall models, diagrams were created upfront. In agile, they evolve.
This flexibility ensures the diagram remains relevant. A static diagram created months ago is often obsolete by the time development starts. Treating it as a living artifact aligns with iterative development.
Requirements change. This is inevitable. The diagram must reflect these changes to remain useful.
Change Management:
Version control is essential. Even without a specific tool, maintaining a history of diagram revisions helps track the evolution of the system. This traceability is vital for audits and understanding why certain features were designed a certain way.
Use Case Diagrams provide the foundation for test cases. Every use case represents a scenario that must be validated.
QA teams can derive test scenarios directly from the diagram. If an actor cannot reach a use case in the diagram, there is likely a testing gap. This alignment reduces the risk of missed defects.
Even experienced teams make errors when modeling. Being aware of these pitfalls saves time and confusion.
Keep the diagram focused on functionality. If a requirement is about speed or security, document that separately rather than cluttering the diagram.
The value lies in clarity and alignment. A Use Case Diagram is a tool for thinking and communicating.
By investing time in this modeling, Product Owners reduce rework and ensure the final product matches the intended vision. It is not about drawing a perfect picture; it is about ensuring everyone understands the picture.
To recap the essential takeaways for effective modeling:
| Concept | Key Takeaway |
|---|---|
| Actors | Include humans and external systems. |
| Boundaries | Clearly separate system from environment. |
| Relationships | Use Include for mandatory steps and Extend for optional ones. |
| Agile Fit | Create diagrams just-in-time for sprints. |
| Testing | Every use case must map to a test scenario. |
Adopting these practices creates a robust foundation for product development. The diagram is a means to an end, not the end itself. Its purpose is to facilitate better decisions and smoother execution. By focusing on the core interactions and maintaining clarity, Product Owners can leverage this tool to drive success without getting bogged down in unnecessary complexity.
Remember that the best diagram is the one that is understood by the team. Prioritize readability and accuracy over visual flair. Regular reviews with the development team will ensure the model stays accurate as the product evolves.