 Visual Paradigm Desktop |
  Visual Paradigm Online


In software development, the most expensive bugs are not found in the code. They are found in the requirements. When a development team builds a feature based on a vague description, the result is often rework. This rework consumes time, budget, and morale. A well-structured requirement artifact can act as a shield against these costs. In this case study, we examine how a visual modeling technique identified a critical flaw in a project scope before a single line of code was written.
The project involved a logistics platform designed to connect warehouse operators with delivery drivers. The initial request was straightforward: build a module to manage package handoffs. The team assumed the workflow was linear. However, the introduction of a use case diagram revealed complex edge cases that the original verbal brief had completely missed. This simple visual intervention saved the organization from a significant architectural overhaul later in the lifecycle.
The client was a mid-sized supply chain company expanding its digital infrastructure. They were transitioning from manual tracking to a fully automated system. The primary goal was to reduce the time between package arrival at a hub and its assignment to a driver. The stakeholder group included operations managers, warehouse supervisors, and senior developers.
Initial meetings focused on the “happy path.” This is the ideal scenario where everything goes according to plan. The stakeholders described a process where a driver arrives, scans a barcode, and the system confirms the handoff. Everyone nodded. The project was greenlit. The development team began setting up the database schema and API endpoints.
However, operations are rarely linear. Real-world logistics involve interruptions, errors, and exceptions. Without a formal visual model to stress-test the requirements, the team proceeded with the assumption that the system would only handle standard interactions. This assumption is where the risk began.
A use case diagram is a behavioral view of a system. It illustrates the interactions between external actors and the system itself. It does not show the internal logic or the code structure. Instead, it focuses on the “who” and the “what”.
The key components include:
Creating this diagram forces the team to articulate the boundaries of the system. It makes implicit assumptions explicit. If a stakeholder mentions a process that does not fit into the diagram, it signals a gap in the requirements.
Before the diagram was drafted, the scope was defined by a document that listed high-level features. The team believed the scope was contained within the “Handoff” module. The assumptions were:
These assumptions are common in early planning phases. They allow the team to start work quickly. However, they are fragile. When the reality of the warehouse environment was introduced, these assumptions failed.
The stakeholders did not explicitly state the exceptions. They assumed the system would handle them automatically. The lack of a visual model meant no one questioned the completeness of the flow until it was too late.
The project lead requested a formal review of the requirements using a visual model. This step was not part of the initial timeline but was introduced to validate the architecture. The team gathered the warehouse supervisors to draw the diagram on a whiteboard.
This session changed the dynamic of the project. Instead of discussing abstract features, everyone looked at a concrete map of the workflow. The diagram was built iteratively:
As the diagram grew, the complexity became visible. The whiteboard was no longer a simple line. It branched out into multiple paths. This visual evidence was undeniable.
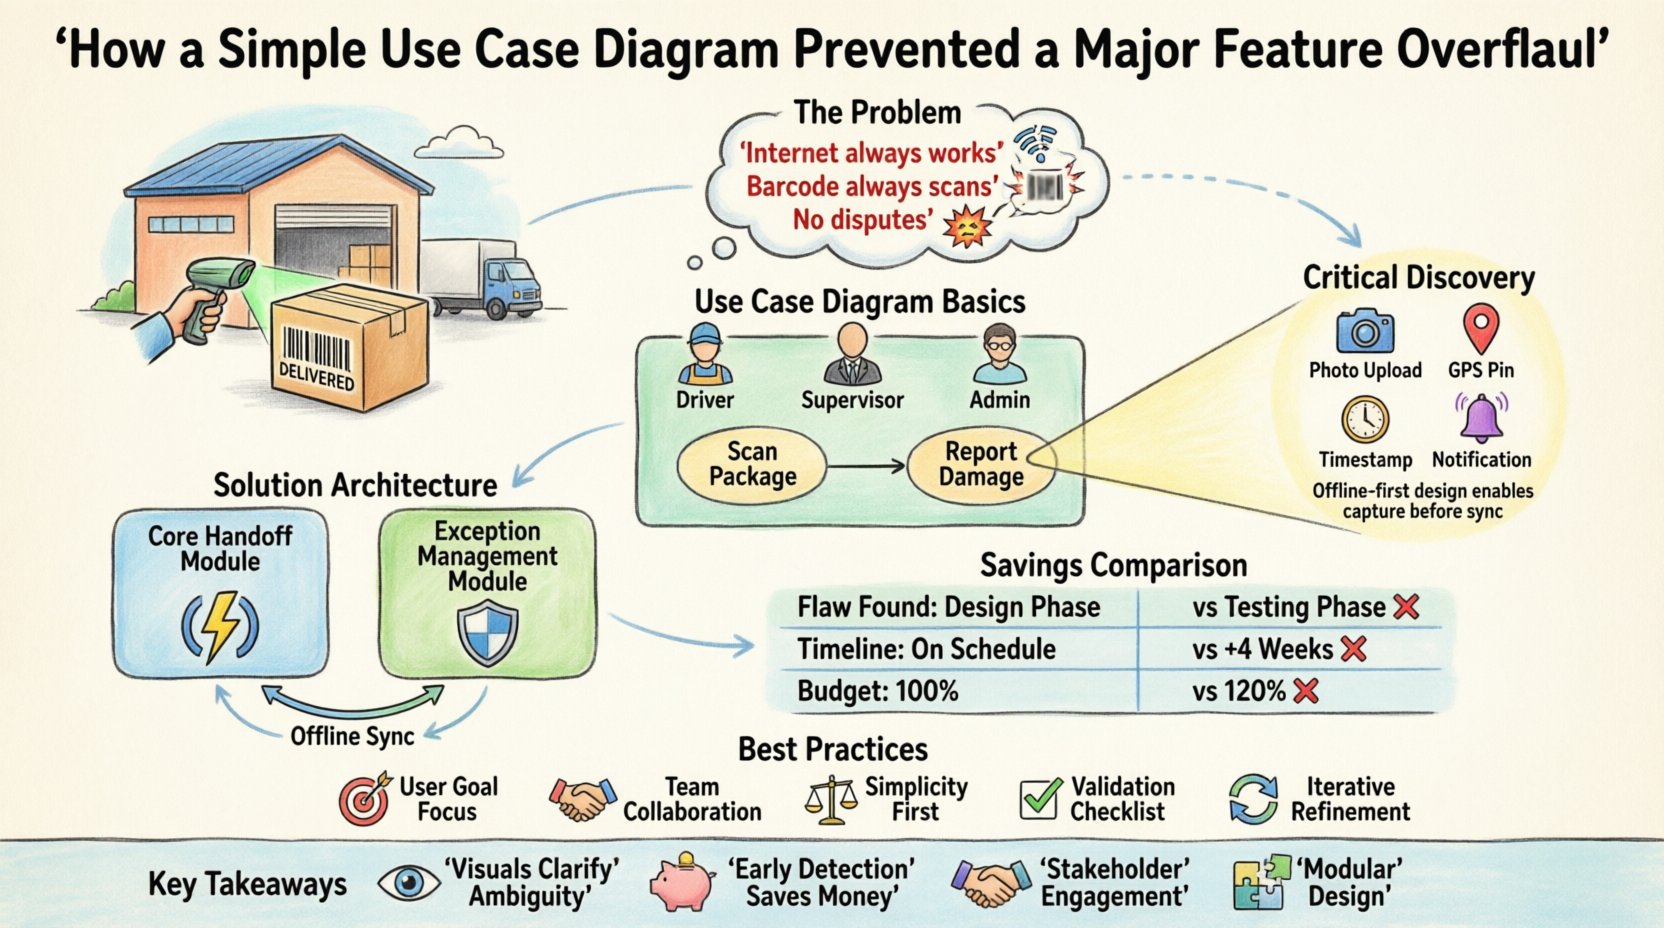
During the modeling session, a specific interaction was flagged that had been overlooked. The “Scan Package” use case was connected to a “Report Damage” use case via an “Extend” relationship. This meant that if a driver scanned a package, they had the option to report damage.
The diagram revealed a dependency that was not in the initial scope. To support “Report Damage,” the system needed to capture photos, GPS coordinates, and a timestamp. It also needed to notify the warehouse supervisor immediately.
Initially, the team thought this was a minor add-on. The diagram showed that this functionality required a completely different data structure. The original database schema was designed for simple status updates. It did not support media attachments or real-time notifications.
Furthermore, the diagram highlighted a conflict between the “Driver” actor and the “Warehouse Supervisor” actor. The driver needed to upload data offline, but the supervisor needed to view it online. This implied a need for local storage and synchronization logic, which was not part of the original plan.
Without the diagram, this discovery would have likely occurred during the testing phase. At that point, changing the database schema would be costly. With the diagram, the team identified the issue during the design phase.
Once the gap was identified, the architecture was adjusted. The team decided to split the module into two distinct components:
This separation of concerns simplified the core module. It could remain lightweight and fast. The exception module could be more complex without slowing down the primary workflow.
The diagram also clarified the permissions. The “Report Damage” use case was extended to include a “Manager Approval” step. This added a layer of security that was previously missing. The visual model made it clear that not all damage reports were equal. Some required immediate intervention, while others could be logged for later review.
The impact of this visual modeling exercise was measurable. By identifying the requirements early, the project avoided a major overhaul after development had begun. The table below summarizes the differences between the “Without Diagram” scenario and the “With Diagram” scenario.
| Metric | Without Visual Model | With Visual Model |
|---|---|---|
| Discovery of Critical Flaw | Post-Development (Testing Phase) | Pre-Development (Design Phase) |
| Database Refactoring Required | Yes (High Cost) | No (Planned from Start) |
| Project Timeline Impact | Delayed by 4 Weeks | On Schedule |
| Stakeholder Confidence | Low (Uncertainty) | High (Visual Confirmation) |
| Development Effort | 120% of Estimate | 100% of Estimate |
The cost of changing a requirement in the design phase is significantly lower than in the coding phase. The diagram allowed the team to calculate the effort accurately. They knew exactly what they were building before they started.
To replicate this success, teams should follow specific guidelines when creating use case diagrams. These practices ensure the model is useful and not just a formality.
Using these practices prevents the diagram from becoming outdated or irrelevant. It ensures that the model remains a valuable tool throughout the project lifecycle.
Even with good intentions, teams can make mistakes when modeling requirements. These pitfalls can lead to confusion rather than clarity.
Avoiding these errors ensures that the diagram serves its purpose. It becomes a communication tool, not a technical constraint.
The case study demonstrates that visual modeling is not just a bureaucratic step. It is a strategic asset. The use case diagram acted as a filter for the requirements. It caught the errors that text-based documents missed.
For project managers and developers, the lesson is clear. Do not rely solely on text descriptions. Use visuals to bridge the gap between business needs and technical implementation. When the requirements are clear, the code is easier to write. When the code is easier to write, the product is higher quality.
The investment in creating a simple diagram paid for itself many times over. It prevented a major feature overhaul. It kept the project on schedule. It ensured that the final product met the actual needs of the users.
In the future, this organization plans to make use case modeling a mandatory step for all major feature requests. The cost of the modeling session is a fraction of the cost of rework. The return on investment is clear.
By prioritizing clarity over speed in the early stages, teams can achieve speed and quality in the later stages. The path to a successful project is paved with clear requirements. Use case diagrams are a reliable map for that journey.
The difference between a project that succeeds and one that struggles often comes down to how well the requirements were understood. A simple diagram can make all the difference.