 Visual Paradigm Desktop |
  Visual Paradigm Online


In the fast-paced environment of modern software development, clarity is the currency of success. Agile leaders often find themselves navigating the tension between rapid delivery and thorough understanding. While user stories provide a granular view of functionality, they sometimes lack the broader perspective needed to see how different user roles interact with the system as a whole. This is where visual modeling steps in. Specifically, the use case diagram serves as a bridge between abstract requirements and concrete implementation.
This guide is designed for leaders who want to leverage visual tools without getting bogged down in rigid processes. We will explore how these diagrams function within an iterative framework, how to construct them effectively, and why they remain relevant even when workflows are fluid. By the end of this walkthrough, you will understand how to use these diagrams to prevent scope creep, align teams, and ensure that the final product matches the intended vision.
Agile methodologies prioritize working software over comprehensive documentation. However, this does not mean documentation is obsolete. It means documentation must be valuable, concise, and alive. A use case diagram is not a heavy artifact; it is a communication tool. It helps stakeholders visualize the system’s behavior from the perspective of the user.
For an Agile leader, the benefits are multifaceted:
When a team understands the “what” before the “how”, they reduce the cognitive load during implementation. This diagram acts as a map, ensuring everyone is walking the same path.
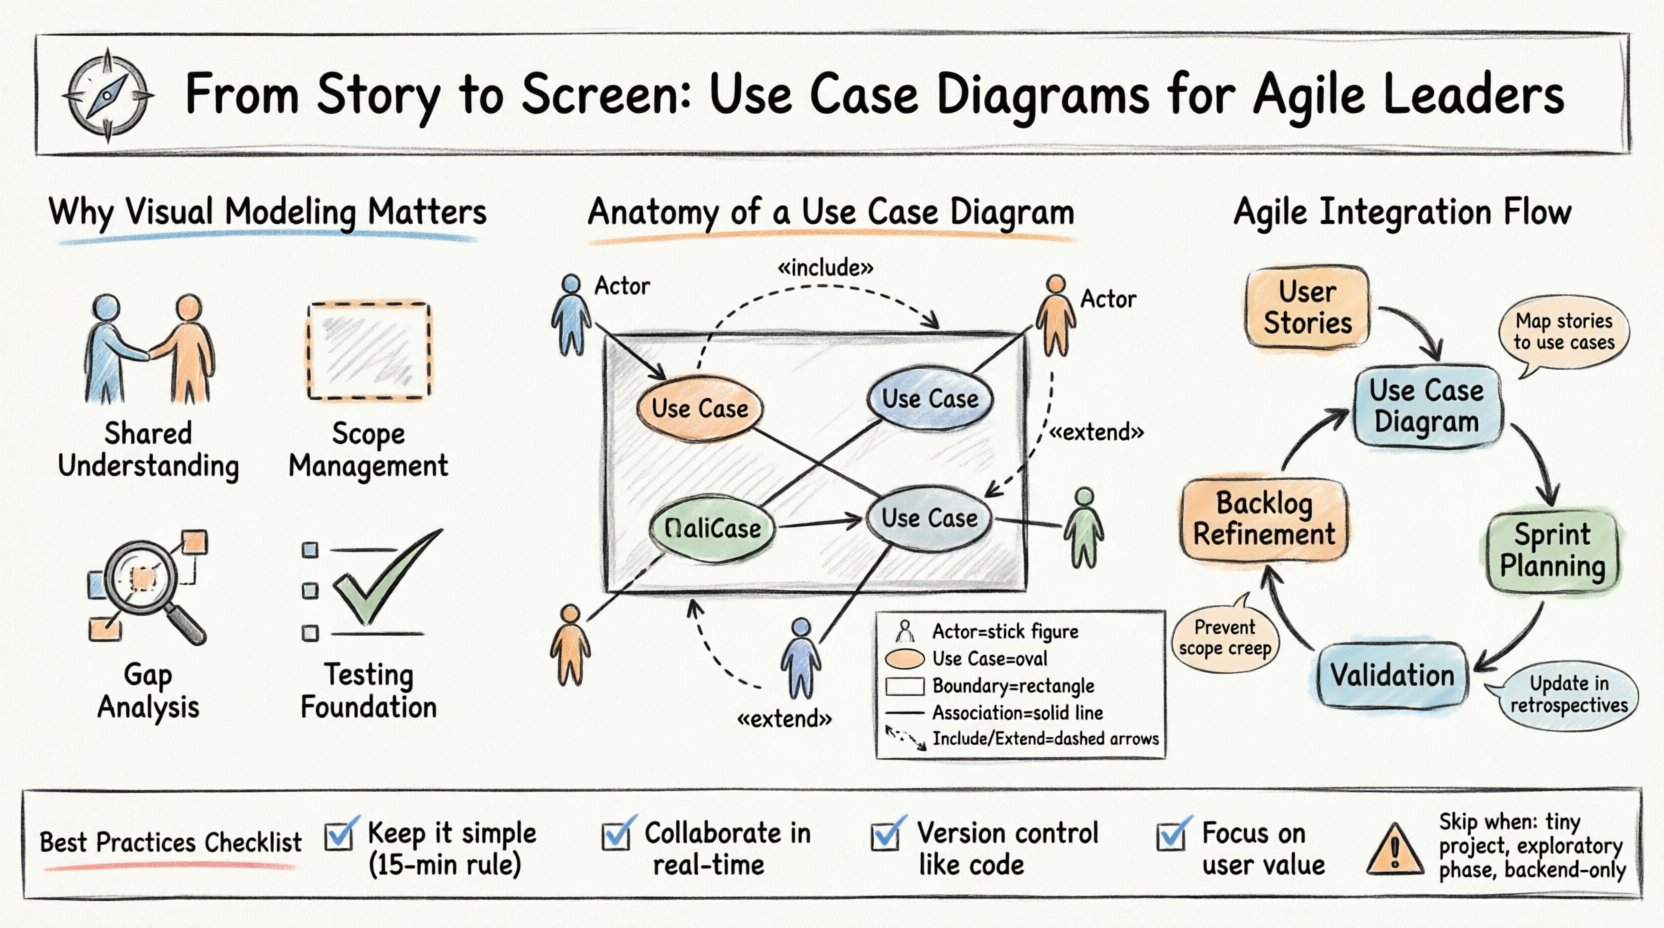
To utilize these diagrams effectively, one must understand the standard components. These elements are not arbitrary; they represent specific concepts in system behavior. Keeping them consistent ensures that anyone looking at the diagram, regardless of their technical background, can interpret it correctly.
An actor represents a role that interacts with the system. It is not a specific person, but a job function. For example, “Administrator” is an actor, whereas “John Smith” is a specific user. Actors are typically depicted as stick figures.
These are the specific goals or functions the system provides. They are usually represented as ovals or ellipses. A use case describes a sequence of actions that yields a result of value to an actor.
This is a box that encloses the use cases. It clearly defines what is inside the system and what is outside. Anything represented outside the box is an actor or an external system. This distinction is crucial for understanding responsibility.
Lines connect actors to use cases, indicating interaction. Other lines define relationships between use cases themselves.
The following table outlines the core components and their visual representation:
| Component | Visual Symbol | Meaning |
|---|---|---|
| Actor | Stick Figure | A role interacting with the system. |
| Use Case | Oval / Ellipse | A specific function or goal. |
| System Boundary | Rectangle Box | Defines the scope of the system. |
| Association | Solid Line | Communication between Actor and Use Case. |
| Include | Dashed Arrow | One use case always includes another. |
| Extend | Dashed Arrow | One use case optionally extends another. |
One common misconception is that diagrams belong to the Waterfall phase. In reality, these visuals adapt well to iterative development. The key is to treat the diagram as a living artifact that evolves alongside the backlog.
Every use case can be broken down into multiple user stories. The diagram provides the umbrella under which stories sit. This hierarchy helps in backlog refinement.
During sprint planning, teams often focus on the details of a specific story. A high-level view prevents tunnel vision. By referring to the diagram, the team ensures that the story they are picking up contributes to the broader system behavior. It answers the question: “Does this story fit the overall interaction model?”
Creating a diagram should be a collaborative effort. It is not a task for one person to complete in isolation. Here is a structured approach to building a meaningful model.
As systems grow, simple lines are not enough. Two specific relationships help manage complexity without cluttering the diagram.
This relationship indicates that one use case always requires the functionality of another. It is a mandatory dependency.
This relationship indicates that one use case optionally adds behavior to another. It is conditional.
Confusing these two is a common mistake. If the behavior is mandatory, use Include. If it depends on a specific condition or exception, use Extend.
Even experienced teams fall into traps when modeling. Awareness of these common issues helps maintain the quality of the artifact.
| Pitfall | Impact | Better Approach |
|---|---|---|
| Over-Engineering | Diagram becomes too complex to read. | Keep it high-level. Split into sub-systems if needed. |
| Confusing Flowcharts | Shows steps instead of goals. | Focus on “What”, not “How”. |
| Ignoring Actors | Misses external system dependencies. | Include secondary actors like APIs or databases. |
| Static Maintenance | Diagram becomes outdated after the first sprint. | Update the diagram during retrospectives or backlog refinement. |
A diagram is useless if it does not align with the backlog. Validation is an active process.
Review every use case on the diagram. Is there a corresponding user story in the backlog? If a use case has no stories, it is a hidden requirement. If a story has no use case, it might be a technical task that needs re-evaluation.
Ensure that no actor interacts with a use case outside the system boundary. If an actor is drawn inside the box, it implies they are part of the system, which is usually incorrect.
While the diagram shows interactions, it does not show the order. For complex flows, pair the diagram with a sequence description or a story map. The diagram provides the map; the story map provides the journey.
In Agile, change is constant. A diagram created at the start of a project will likely need updates. This is not a sign of failure; it is a sign of learning.
Do not let the diagram become a ceremonial artifact. It should be a practical tool that the team reaches for when confusion arises.
Not every project needs a formal diagram. Agile leaders must exercise judgment.
The goal is efficiency. If the diagram slows you down more than it helps, simplify it or skip it for the time being.
Visual modeling is not about drawing pretty pictures. It is about thinking clearly. For an Agile leader, the use case diagram offers a way to enforce alignment without adding bureaucracy. It forces the team to define boundaries, identify actors, and agree on goals before writing a single line of code.
By integrating this practice into your workflow, you reduce the risk of rework. You give your team a shared vocabulary. You provide a reference point that survives the churn of sprint cycles. The diagram does not replace communication; it enhances it. It ensures that when the story moves from the backlog to the screen, the intent remains intact.
Start small. Pick one feature. Draw the interactions. Discuss them. Update them. Let the diagram serve the team, not the other way around. This pragmatic approach ensures that visual modeling remains a valuable asset in your agile toolkit.