 Visual Paradigm Desktop |
  Visual Paradigm Online


In complex development environments, miscommunication is the costliest inefficiency. 🛑 When product goals drift from technical reality, and user needs are overlooked, projects stall. A Use Case Diagram serves as more than a technical artifact; it is a communication bridge.
This guide explores how to construct diagrams that function as a shared language. By visualizing interactions, we reduce ambiguity and ensure every stakeholder sees the same system behavior. Whether you are defining requirements or validating architecture, clarity is the primary metric of success.
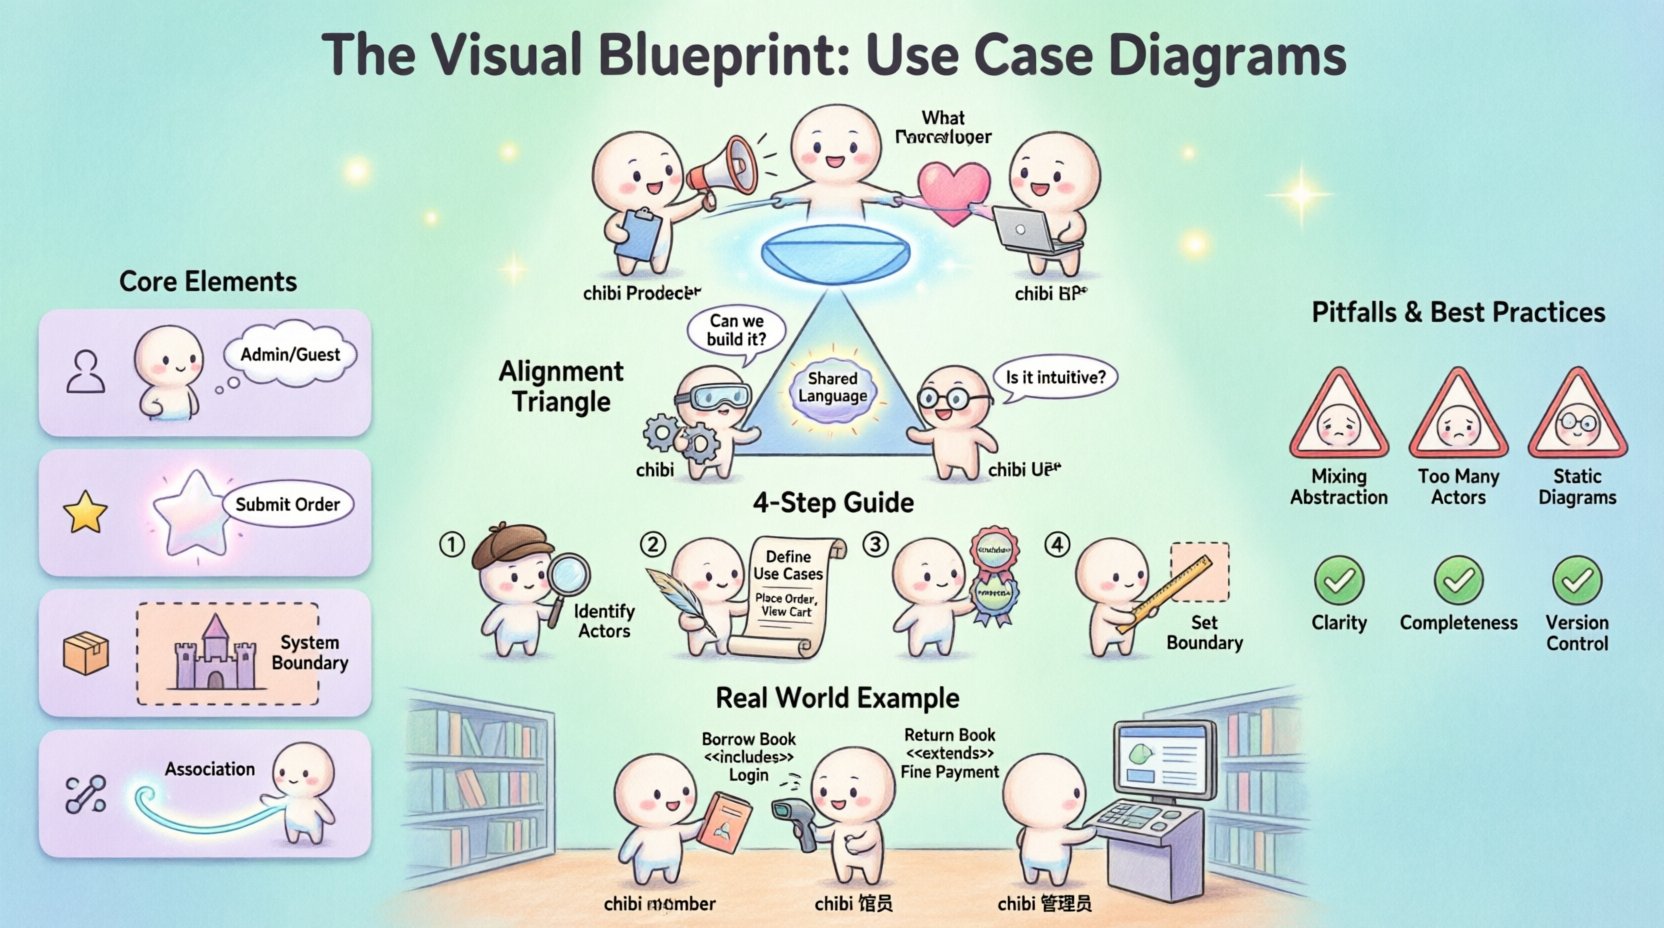
Before drawing lines, one must understand the vocabulary of the diagram. A Use Case Diagram is a type of Unified Modeling Language (UML) chart. It focuses on the what of the system, not the how.
When these elements are defined correctly, the diagram becomes a contract between the business and the engineering team.
Effective diagrams balance three distinct perspectives. If one side is missing, the blueprint fails.
| Perspective | Focus Question | Diagram Contribution |
|---|---|---|
| Product | What value does this feature deliver? | Ensures the use case matches the business goal. |
| Technology | Can we build this securely and scalably? | Validates system boundaries and integration points. |
| Users | Is this workflow intuitive and accessible? | Confirms the actor’s intent and interaction flow. |
Consider a scenario where a Product Manager requests a “One-Click Purchase.” 🛒 Without a diagram, the Tech team might build a complex API integration that slows down the process. The Users might find the button confusing. A diagram clarifies the interaction flow before code is written.
Building a robust diagram requires a methodical approach. Follow these steps to ensure consistency and accuracy.
Start by listing who interacts with the system. Do not list every single user. Group them by shared goals.
This abstraction keeps the diagram clean and applicable to multiple individuals.
Brainstorm actions each actor can perform. Use verb-noun phrases for clarity.
Avoid technical jargon here. “Query Database” is an implementation detail. “Retrieve Data” is a user goal.
Connect actors to their relevant use cases. Then, look for relationships between use cases themselves.
Draw a rectangle around the use cases. Label it clearly. Anything outside this box is an external system or a human actor.
Even experienced teams make mistakes when modeling. Recognizing these errors early saves weeks of rework.
Use this table to audit your work before presenting it to the team.
| Criteria | Checklist Item |
|---|---|
| Clarity | Are actor names consistent across the document? |
| Completeness | Does every actor have at least one path to value? |
| Scope | Is the system boundary clearly defined and labeled? |
| Readability | Do lines cross each other unnecessarily? (Use splines if needed) |
| Maintainability | Is the file saved in a shared repository with version history? |
A diagram is only valuable if it remains accurate. As features are added, the diagram must change.
Just like code, diagrams need versions. When a major change occurs, update the diagram version number. This prevents confusion between “v1.0 requirements” and “v2.0 features.”
Document why changes were made. Was it a user feedback loop? Was it a technical constraint? Context helps future maintainers understand the history of the system.
Schedule regular reviews with Product and Engineering leads. This ensures the visual representation matches the current build state. If the code has changed but the diagram hasn’t, trust the diagram less.
A Use Case Diagram does not exist in isolation. It connects to other documentation.
While functionality is key, readability matters. A messy diagram leads to a messy understanding.
Imagine a library system. 📚
If the “Borrow Book” use case requires a “Fine Payment” if overdue, this is an Extend relationship. If “Return Book” Includes “Check for Damages,” the flow is mandatory.
By mapping this out, the Librarian knows their workflow. The Developer knows what database triggers are needed. The Member understands the rules of borrowing. Everyone is aligned.
Creating these diagrams is a discipline of empathy. It requires seeing the system through the eyes of the actor, the constraints of the engineer, and the goals of the business owner. When done right, it eliminates friction. It turns vague ideas into concrete plans.
Start small. Pick one module. Define the actors. Draw the lines. Review. Iterate. This iterative process builds a culture of clarity. As the system grows, so does the blueprint. Keep it updated, keep it accessible, and keep it honest. This is how teams build software that truly works for everyone involved.