 Visual Paradigm Desktop |
  Visual Paradigm Online


System integration is the backbone of modern digital infrastructure. It connects disparate applications, databases, and services to function as a cohesive unit. However, the complexity of data moving between these systems can become opaque quickly. This is where a Data Flow Diagram (DFD) becomes essential. A DFD provides a visual representation of how data travels through a system, highlighting inputs, processes, storage, and outputs. When applied to system integration, it serves as a blueprint for understanding data lineage and dependencies.
Without a clear map, integration projects risk data inconsistencies, security vulnerabilities, and bottlenecks. By visualizing data across multiple components, architects and engineers can identify gaps before they become critical failures. This guide explores the methodology of using DFDs specifically within the context of integrating complex systems.
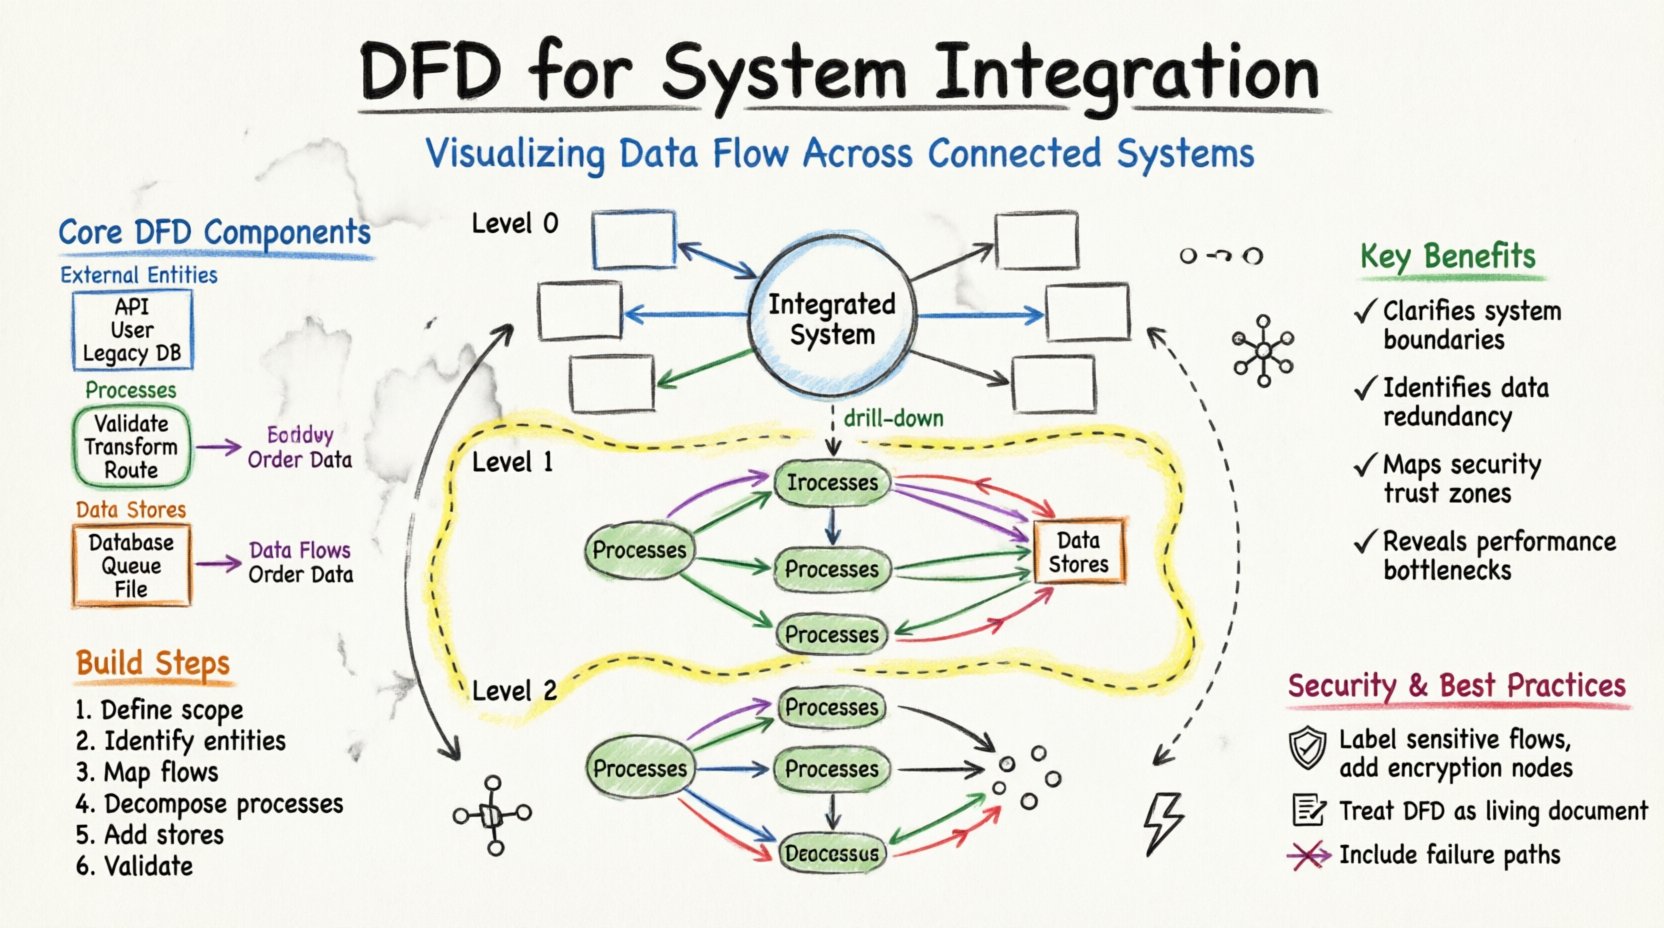
Before diving into integration specifics, it is necessary to understand the fundamental building blocks of a DFD. These elements remain consistent regardless of the system’s complexity.
It is important to distinguish DFDs from flowcharts. Flowcharts focus on control flow and decision logic (if/else paths). DFDs focus strictly on data movement. In system integration, data integrity is often more critical than the specific decision path taken. Therefore, a DFD is the preferred tool for mapping data transformation pipelines.
When multiple systems need to communicate, the architecture often resembles a mesh. Without a central visualization, the connections can become a tangled web. A DFD helps clarify this complexity by layering the information.
To manage complexity, DFDs are typically created at different levels of abstraction. This hierarchy allows stakeholders to view the system from a high-level overview down to specific technical details.
The Context Diagram is the highest level of abstraction. It treats the entire integrated system as a single process. It shows the system’s interaction with external entities.
This diagram breaks the main process into major sub-processes. It is the primary map for integration architects.
Level 2 diagrams drill down into specific sub-processes from Level 1. They are used by developers and engineers implementing specific logic.
Creating a robust DFD requires a structured approach. It is not merely a drawing exercise but a modeling activity that requires understanding the business logic.
Start by listing all systems that will participate in the integration. Distinguish between systems that generate data and systems that consume it. Define the organizational boundary. What data flows are internal, and which cross into the public domain?
List every source and destination. This includes:
Draw arrows connecting entities to the central system. Label these flows with the type of data moving (e.g., “Order Details”, “Inventory Status”). Do not worry about internal logic yet. Focus on the movement.
Break the central system into logical processes. For example, instead of one process called “Handle Order”, split it into “Validate Order”, “Check Inventory”, and “Process Payment”. This decomposition reveals where data is transformed.
Identify where data must be saved. In integration, this might be a temporary staging area or a permanent warehouse. Ensure every data store has a connection to a process that writes to it and a process that reads from it.
Check for common errors. Ensure no data flow starts or ends at nothing. Every arrow must have a start and an end. Verify that data stores are not bypassed when data needs to persist.
Building DFDs for integration is not without hurdles. Data inconsistency and hidden dependencies are common pitfalls. The table below outlines frequent issues and recommended approaches to resolve them.
| Challenge | Description | Solution |
|---|---|---|
| Data Redundancy | Multiple systems store the same customer information independently. | Consolidate data stores in the DFD to a single source of truth where possible. |
| Hidden Dependencies | Data flows depend on background tasks not visible in the diagram. | Include asynchronous processes and background jobs as explicit processes in the DFD. |
| Security Gaps | Unencrypted data flows across public networks. | Label secure flows and apply encryption processes at network boundaries. |
| Legacy System Interfaces | Old systems do not have standard APIs. | Model the wrapper or middleware required to translate data formats. |
| Volume Spikes | Data flow increases unexpectedly during peak times. | Add buffering data stores to absorb traffic spikes before processing. |
To ensure the DFD remains useful over time, adhere to these design principles. A diagram that is too complex becomes unreadable; one that is too simple becomes inaccurate.
System integration rarely involves data moving exactly as is. Formats change, fields are added, and values are calculated. The DFD must reflect these transformations.
When data enters a system, it often needs to be standardized. For instance, a date format might be “DD/MM/YYYY” in one system and “YYYY-MM-DD” in another. The DFD should show a process node specifically for “Format Standardization”.
Sometimes data is combined with other sources to add value. For example, an order might be enriched with current exchange rates. This requires a process that pulls data from a secondary source (like a currency store) and merges it with the primary flow.
Security requirements often dictate that sensitive data be hidden. If a process sends data to a logging system, the DFD should show a transformation step that masks credit card numbers or social security numbers before the data leaves the secure zone.
Different architectural patterns utilize data flows differently. Understanding these patterns helps in drawing the correct DFD.
A DFD is not a one-time artifact. Systems evolve, new APIs are introduced, and old ones are deprecated. A stale diagram can lead to bugs and security breaches. Maintenance is a critical phase of the DFD lifecycle.
Updates to the DFD should be triggered by:
Keep the diagram linked to the codebase or configuration files. When a developer changes a data mapping script, they should update the DFD simultaneously. This ensures the documentation remains a source of truth.
Security is not an add-on; it is a fundamental aspect of data flow. When visualizing data, you must consider where trust boundaries exist.
To illustrate the practical application, consider a scenario where a company sells products through a website, a mobile app, and a physical store.
The entities include the Website, Mobile App, POS System, and the Customer.
Key processes include “Order Ingestion”, “Inventory Deduction”, and “Payment Processing”.
When a customer buys an item:
This visualization makes it clear that if the Inventory Store is down, the Order Ingestion might succeed but the fulfillment will fail. This dependency is visible only through the diagram.
Data Flow Diagrams offer a structured way to understand the movement of information within complex system integrations. They transform abstract code and API calls into a visual language that stakeholders can understand. By following the steps outlined here, teams can create accurate maps of their data architecture.
Effective DFDs lead to better system design, fewer integration errors, and clearer security boundaries. They serve as a living document that guides development and maintenance. In an environment where data is the most valuable asset, visualizing its journey is not optional—it is a necessity for operational excellence.