 Visual Paradigm Desktop |
  Visual Paradigm Online


Entering the field of systems analysis brings a wave of new concepts, terminology, and diagrams. Among these, the Data Flow Diagram (DFD) stands as a cornerstone for visualizing how information moves through a system. It provides a clear picture of processes, data storage, and external interactions without getting bogged down in technical implementation details. However, for those new to the role, understanding the nuances can be challenging. This guide addresses the ten most frequent inquiries from analysts starting their journey with DFDs. We will explore the definitions, distinctions, and best practices that ensure your diagrams communicate effectively with stakeholders and developers.
A Data Flow Diagram is a graphical representation of the flow of data through an information system. Unlike a flowchart, which depicts the sequence of operations or control flow, a DFD focuses on the movement of data. It answers the question: “Where does the data come from, where does it go, and how does it change along the way?” This abstraction allows stakeholders to understand the logical requirements of a system without needing to know the programming language or database schema being used.
Key characteristics include:
Understanding this distinction is vital. When an analyst creates a DFD, they are creating a map of the business logic. This map serves as a bridge between business requirements and technical specifications, ensuring that everyone agrees on the data journey before a single line of code is written.
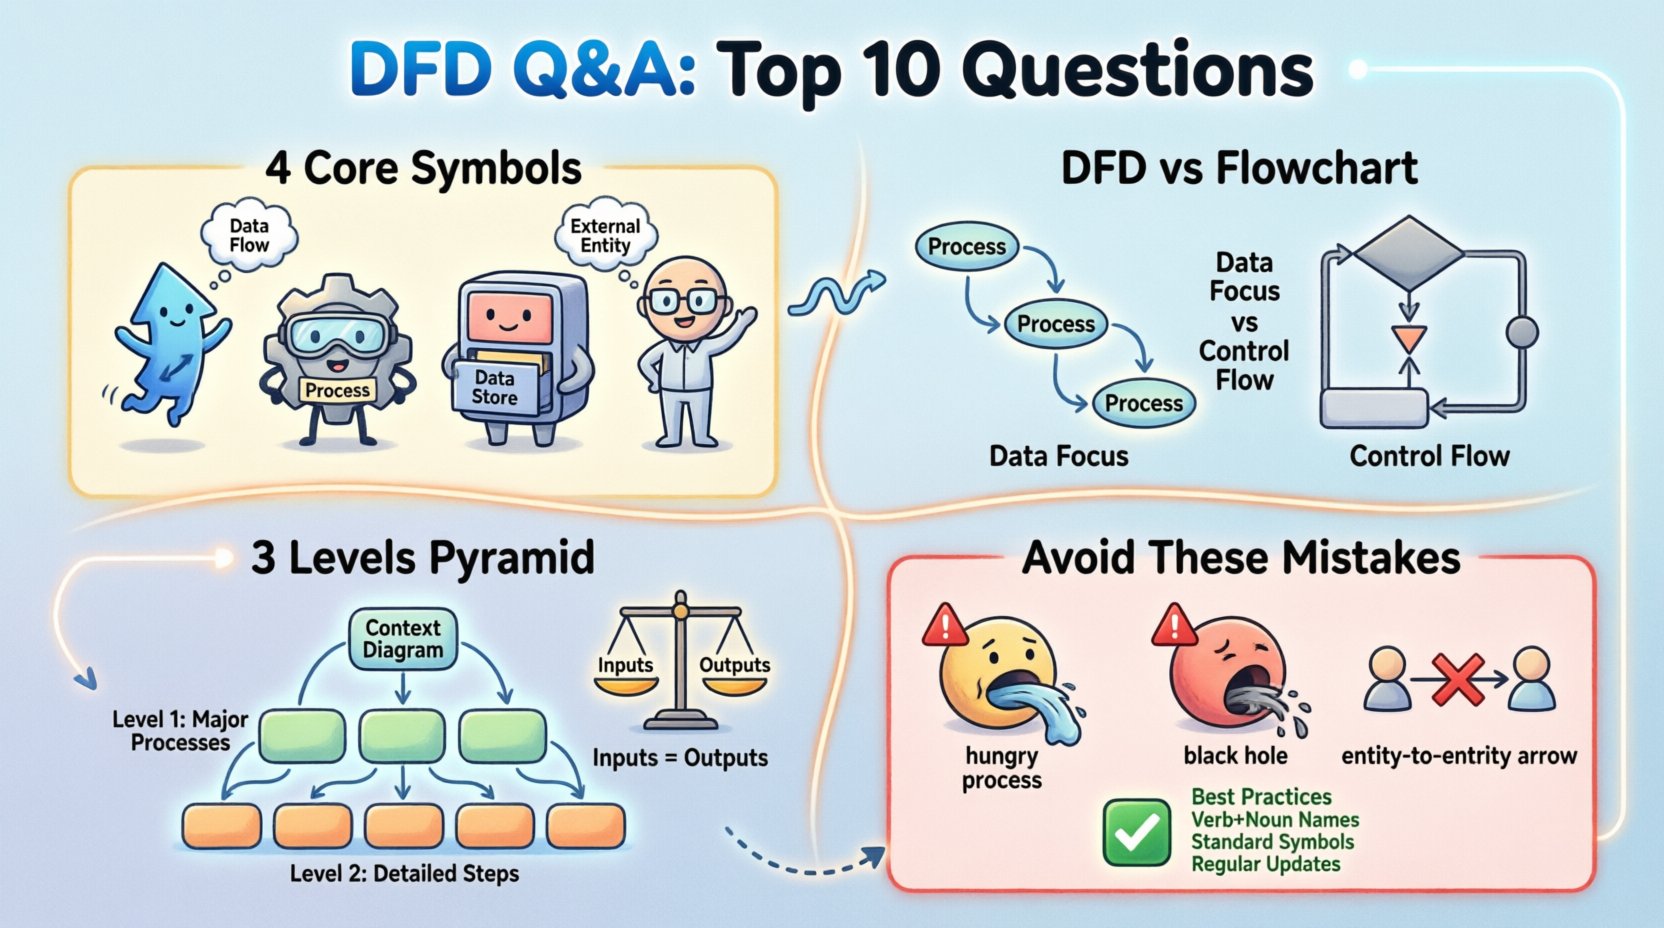
This is a common point of confusion. While both use shapes and arrows, their purposes are fundamentally different. A flowchart illustrates the control flow of a program or procedure. It shows decision points (yes/no), loops, and the exact sequence of steps. It is often too detailed for high-level system analysis.
Conversely, a DFD abstracts away the control logic. It does not show loops or decision branches. Instead, it shows the transformation of data. If you are designing a database, a flowchart might show the query logic. A DFD would show the data moving from a user form into the database table.
Key differences to remember:
Standard DFDs rely on four specific symbols to represent system components. Using these consistently ensures that anyone reading the diagram understands the notation immediately.
| Symbol | Name | Function | Visual Representation |
|---|---|---|---|
| Arrow | Data Flow | Shows movement of data between components | Labeled Line |
| Circle or Rounded Rect | Process | Transforms input data into output data | Circle / Box |
| Open Rectangle | Data Store | Stores data for later use | Two Parallel Lines / Box |
| Rectangle | External Entity | Source or destination of data outside the system | Box |
Each symbol plays a distinct role. The Process changes the data. The Data Store holds it. The External Entity provides or consumes it. The Data Flow connects them. Mixing these up can lead to significant misunderstandings during the development phase.
Complex systems require different levels of detail to remain understandable. We typically break DFDs into three hierarchical levels. This process is known as “decomposition” or “exploding” the diagram.
Each level must maintain consistency with the one above it. You cannot introduce new data flows in a lower level that were not present in the higher level unless they are balanced correctly.
Balancing is a critical rule that ensures the integrity of your diagram across levels. It states that the inputs and outputs of a parent process must match the inputs and outputs of the child processes below it. If a Level 1 process has an input “User ID,” the Level 2 diagram that decomposes that process must also show “User ID” entering the sub-processes.
Violating balancing creates confusion. It suggests that data is being created or destroyed magically, which is impossible in a logical system. When reviewing a diagram, always check the edges. If a line enters a box in Level 1, that line must appear in the corresponding Level 2 diagram.
Why this matters:
Names are not just labels; they are documentation. A process name should be a verb followed by a noun. For example, “Calculate Tax” is better than “Tax Calculation.” The verb indicates an action or transformation, while the noun indicates the subject matter.
Common naming errors include:
Consistency in naming helps analysts quickly scan the diagram and understand the function of each component without needing a legend.
In a DFD, a Data Store represents a place where data is held. It is a logical concept. In the physical system, this might be a SQL table, a flat file, a spreadsheet, or a cloud bucket. The DFD does not care about the implementation technology.
However, a common mistake is to treat the Data Store as a temporary buffer. A Data Store must persist. If the system shuts down, the data remains. This distinguishes it from transient data flows.
When designing the physical system later, the analyst or architect must map each Data Store to a physical storage solution. If a Data Store is labeled “Customer Records,” the database team knows to create a table with that schema. If the DFD implies no storage is needed for a specific data flow, no database table should be created for it.
External Entities are people, organizations, or other systems that interact with the system being modeled but exist outside its boundary. They are the source or destination of data.
Examples include:
It is crucial to distinguish between an entity inside the system and one outside. If a component is part of the system’s internal logic, it should be a Process or Data Store. If it is outside the boundary, it is an Entity. Confusing these can lead to scope creep, where developers are asked to build components that belong to third-party systems.
Even experienced analysts make errors. Identifying these common pitfalls early can save significant rework later. Below are the most frequent issues found in initial drafts.
Reviewing your diagrams against this checklist can significantly improve their quality before presentation to stakeholders.
A diagram is not a static artifact; it is a living document. As business requirements change, the system must evolve. If the process “Calculate Discount” changes to “Apply Tiered Discount,” the DFD must be updated. Failing to update the diagram leads to a disconnect between the documentation and the actual software.
Best practices for maintenance include:
Treating the DFD as a reference document that must be kept current ensures that future developers and analysts can understand the system without relying solely on memory or outdated notes.
To ensure your Data Flow Diagrams serve their purpose effectively, adhere to these core principles. Clarity is the primary goal. If a stakeholder cannot understand the flow of data after a quick glance, the diagram has failed its purpose. Use the standard symbols consistently. Keep the levels distinct. Name your processes clearly. Balance your inputs and outputs. And always remember that the diagram is a tool for communication, not just a technical requirement.
By mastering these foundational concepts, you build a strong base for complex system analysis. You provide a clear roadmap for development teams and a clear view of requirements for business leaders. This shared understanding is the key to successful system implementation.
Remember, the value of a DFD lies in its ability to simplify complexity. It allows you to see the forest and the trees simultaneously. Use it to guide your analysis, validate your requirements, and communicate your vision. With practice, creating these diagrams will become a natural part of your workflow, helping you navigate the intricacies of system design with confidence.