Visual Paradigm Desktop | Visual Paradigm Online
Read this post in: de_DEes_ESfr_FRhi_INid_IDjapl_PLpt_PTru_RUvizh_CNzh_TW

DFD Without Tools: How to Draw Effective Diagrams by Hand or in Simple Apps

DFD4 days ago

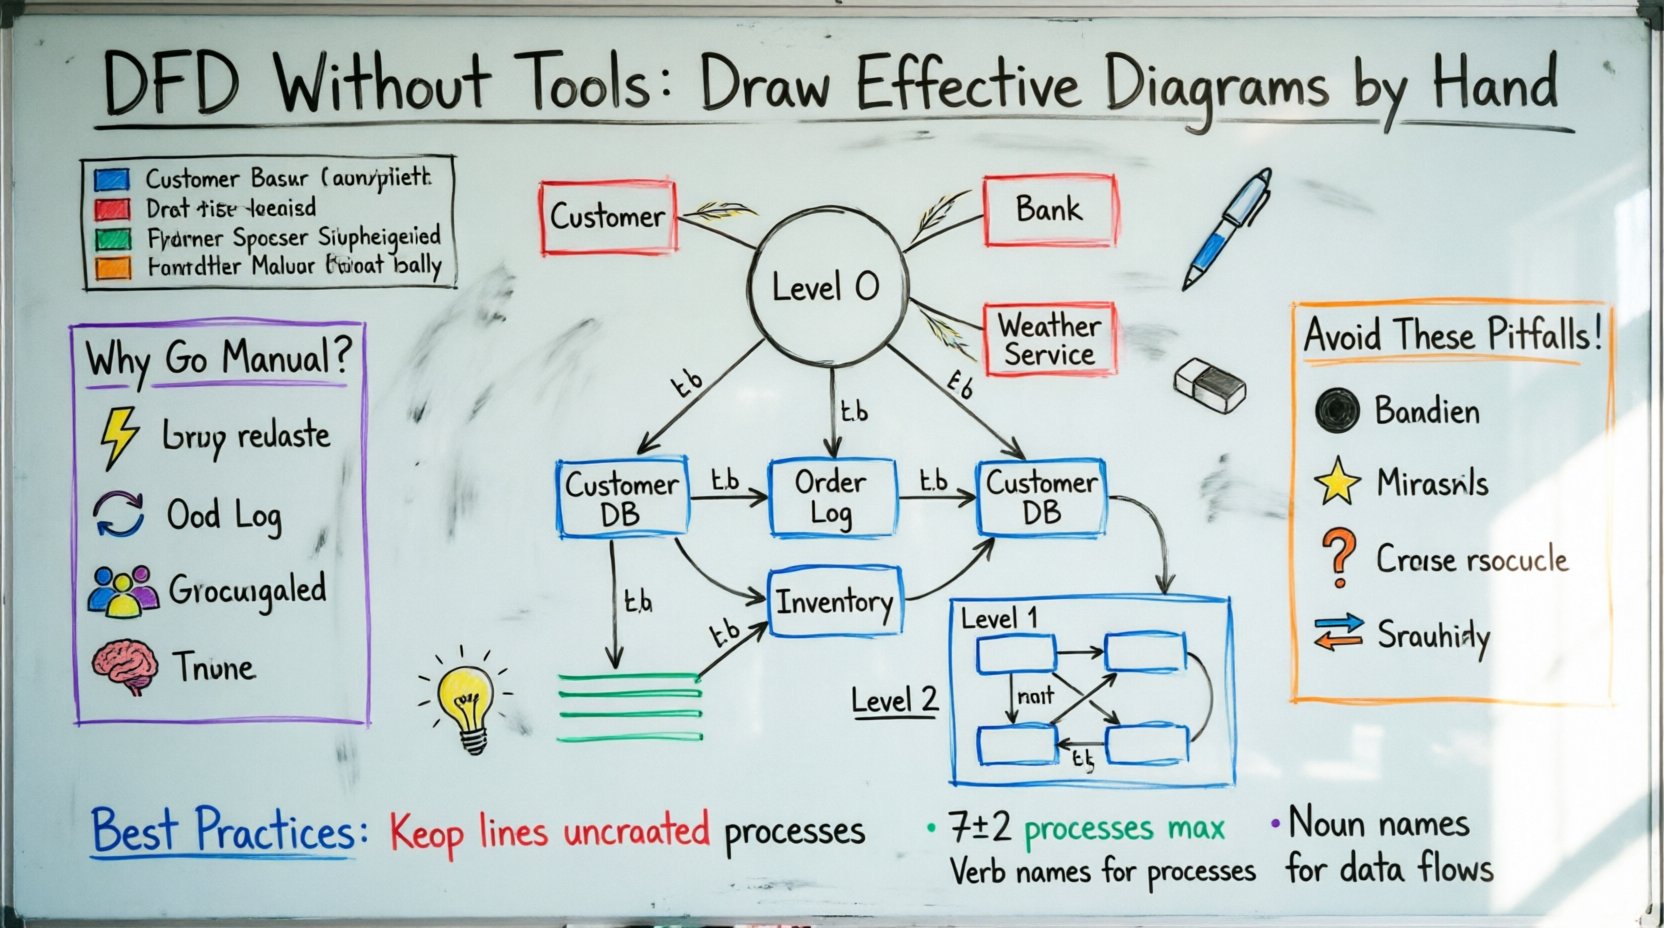
Creating a Data Flow Diagram (DFD) does not require expensive software licenses or complex interfaces. In fact, starting with the simplest tools often yields the clearest results. This guide explores how to design accurate data flow diagrams using paper, whiteboards, or basic digital editors. By focusing on structure and logic rather than aesthetics, you can build robust system models that stand the test of time.

A hand-drawn whiteboard style infographic illustrating how to create Data Flow Diagrams without specialized software, featuring color-coded marker sections for DFD components (entities in red, processes in blue, data stores in green, flows in black), three hierarchy levels (Context, Functional Decomposition, Detailed Breakdown), manual vs digital benefits, common pitfalls to avoid, and best practices for clear system modeling—all presented in an authentic sketchy whiteboard aesthetic with handwritten typography.

🧠 Why Start Without Specialized Software?

Many professionals jump straight into digital tools, only to get lost in formatting options. Manual drawing forces you to focus on the core logic of the system. When you use a pen or a basic marker, you are limited to the essential elements. This constraint is actually a benefit. It prevents you from spending hours perfecting colors or shapes before the logic is sound.

Here are the primary advantages of a manual approach:

  • Speed: Sketching is faster than configuring software menus.
  • Flexibility: Erasing and redrawing is immediate with no undo history to manage.
  • Collaboration: A whiteboard or large sheet of paper allows multiple stakeholders to point at and modify the diagram simultaneously.
  • Cognitive Focus: You concentrate on data movement rather than visual polish.

This method is particularly effective during the early discovery phases of system analysis. It helps teams align on requirements before committing to a technical design.

📘 Understanding the Core Components

Before picking up a pen, you must understand the standard symbols used in Data Flow Diagrams. These symbols represent the fundamental building blocks of any process model. Regardless of whether you draw on paper or a screen, the meaning remains the same.

1. External Entities (The Source and Destination)

External entities represent people, organizations, or other systems that interact with your system. They are the boundaries of your model. You should label them clearly to indicate who provides data and who receives the final output.

  • Example: A customer, a bank, a weather service.
  • Visual: Usually a rectangle or a simple icon.

2. Processes (The Transformations)

Processes are the actions that change data. They take input, perform work, and produce output. Every process should have at least one input and one output.

  • Example: Calculate Total, Validate User, Generate Report.
  • Visual: Often a circle, rounded rectangle, or a box with a label.

3. Data Stores (The Memory)

Data stores represent where information is kept for later use. This includes physical files, databases, or even a physical filing cabinet. If data sits somewhere and is accessed later, it belongs in a store.

  • Example: Customer Database, Order Log, Inventory List.
  • Visual: Often an open rectangle or parallel lines.

4. Data Flows (The Movement)

Data flows show the path that information takes. Every arrow must have a label describing the content of the data. Never leave an arrow unlabeled.

  • Example: Login Credentials, Invoice, Search Query.
  • Visual: A directional arrow connecting two elements.

📊 Comparison of Manual vs. Digital Elements

Element Manual Approach Digital/Basic App Approach
Speed of Drafting Very Fast Fast
Editing Capability Requires redrawing or erasing Drag and drop
Consistency Varies by hand Standardized shapes
Portability Requires scanning or photography Instant file sharing
Cost Minimal (Paper & Pen) Free or Low Cost

🌍 The Three Levels of DFD

A complete DFD model is not a single drawing. It is a hierarchy of diagrams that zoom in and out of the system. Understanding these levels is critical for maintaining clarity.

Level 0: The Context Diagram

This is the high-level view. It shows the entire system as a single process and the external entities interacting with it. It answers the question: “What is the system boundary?”

  • Focus: Interaction with the outside world.
  • Detail: Minimal. One process bubble, multiple entities.

Level 1: The Functional Decomposition

This diagram breaks the single process from Level 0 into major sub-processes. It shows the main functions of the system and the data stores involved.

  • Focus: Major functional areas.
  • Detail: 5 to 9 processes is a common rule of thumb.

Level 2: The Detailed Breakdown

This level zooms into specific complex processes from Level 1. It is used when a specific function is too complicated to understand at a high level.

  • Focus: Specific algorithms or workflows.
  • Detail: High granularity.

✍️ Step-by-Step: Drawing by Hand

Creating a diagram manually requires a systematic approach to ensure the final product is logical and readable. Follow these steps to guide your physical creation.

Step 1: Preparation

  • Gather large sheets of paper or a large whiteboard.
  • Use different colored pens to distinguish between types of elements (e.g., blue for processes, red for entities).
  • Keep a ruler handy for straight lines, though freehand is acceptable for initial sketches.

Step 2: Define the Boundary

  • Draw a box or circle to represent the system boundary.
  • Place all external entities outside this boundary.
  • Ensure no data flows cross the boundary without a process in between.

Step 3: Map the Inputs and Outputs

  • Start with the main trigger. What starts the system?
  • Draw arrows from entities to the system.
  • Draw arrows from the system back to entities.
  • Label every arrow clearly.

Step 4: Decompose the Process

  • Break the main process into sub-processes.
  • Connect them using data flows.
  • Add data stores where information is saved.
  • Ensure every process has data flowing in and out.

Step 5: Review and Balance

  • Check if data flows entering a process match the outputs.
  • Verify that no data disappears without a destination.
  • Ensure all external entities are connected.

💻 Drawing in Simple Digital Environments

While specialized tools exist, you do not need them. Basic digital environments can offer the same benefits without the complexity. These include simple drawing apps, presentation software, or even a blank document.

When using a digital interface, adhere to these principles to maintain the “no-tool” spirit:

  • Stick to Basic Shapes: Avoid using 3D effects or gradients. They add noise.
  • Use Grids Sparingly: Grids help alignment but do not dictate design.
  • Focus on Connectivity: Ensure your lines snap or connect logically, just as they would on paper.
  • Version Control: Save your work frequently. If you lose a file, you lose progress.

🚧 Common Pitfalls to Avoid

Even with simple methods, errors can creep into your diagrams. Being aware of these common mistakes will save you time during the validation phase.

  • Black Holes: A process with inputs but no outputs. Data cannot just vanish.
  • Miracle Processes: A process that magically produces data without any input. All data must come from somewhere.
  • Unlabeled Flows: An arrow without a name is useless. It does not tell you what information is moving.
  • Direct Entity-to-Entity Flows: Data cannot flow directly between two external entities without passing through the system.
  • Data Store Confusion: Ensure data stores are distinct from processes. A store holds data; a process changes it.

🔍 Validation Techniques for Manual Diagrams

Once your diagram is drawn, you must verify its accuracy. Manual diagrams are easier to critique physically because you can point directly at elements.

1. The Walkthrough Method

Walk through the diagram with a stakeholder. Ask them to trace a specific piece of data from entry to exit. If they get stuck at an arrow or a process, that area needs clarification.

2. The Balancing Check

Compare Level 0 and Level 1. The inputs and outputs on the context diagram must match the inputs and outputs of the Level 1 diagram. If the Level 1 diagram introduces a new data flow to an external entity that was not in Level 0, you have made an error.

3. The Naming Convention Review

  • Ensure process names are verbs. (e.g., “Process Order”, not “Order Processing”).
  • Ensure data flow names are nouns. (e.g., “Order Details”, not “Sending Order”).
  • Ensure entity names are plural or singular consistently.

🛠️ When to Transition to Digital

Manual diagrams are excellent for discovery and planning. However, there comes a point where digital storage becomes necessary. You should consider digitizing your work when:

  • The Model Grows: The diagram becomes too large for a single sheet of paper.
  • Changes are Frequent: If the system requirements change often, a digital file is easier to update than redrawing on paper.
  • Sharing is Required: Sending a photo of a paper diagram can be blurry. A digital file ensures everyone sees the same resolution.
  • Integration is Needed: If you need to link the diagram to code or database schemas, digital files are more compatible.

📝 Best Practices for Clarity

Regardless of the medium, clarity is the goal of a Data Flow Diagram. A confusing diagram is worse than no diagram at all.

  • Keep it Flat: Avoid crossing lines. If lines must cross, use a “jump” indicator or rearrange the layout.
  • Group Related Processes: Place processes that interact frequently near each other.
  • Use Consistent Spacing: Maintain equal space between shapes to create a sense of order.
  • Limit the Number of Processes: A single diagram should not have more than 7 to 9 processes. If it does, split it into sub-diagrams.
  • Label Data Stores Clearly: Use standard naming conventions like “Customer_Table” or “Order_Log”.

🧩 The Cognitive Benefit of Manual Design

There is a psychological advantage to drawing diagrams by hand. It engages the brain differently than clicking and dragging shapes. This engagement leads to deeper understanding.

When you draw, you slow down. You think about the connection between two points before the line appears. This pause allows you to catch logical errors that might be missed when using a tool that makes drawing easy. The friction of manual drawing is actually a feature, not a bug.

  • Memory Retention: Studies suggest that writing information by hand improves memory retention compared to typing.
  • Problem Solving: The physical act of sketching can help untangle complex logical knots.
  • Focus: Without the distraction of software menus, the mind stays on the problem.

🔗 Integrating with System Requirements

A DFD is not an isolated artifact. It must align with the functional requirements of the system. Use your manual diagram to validate the requirements document.

  • Does every requirement have a corresponding process?
  • Does every data input have a defined destination?
  • Are all constraints represented in the data flows?

If you find a requirement that cannot be mapped to the diagram, it may indicate a missing process or a misunderstanding of the system scope. This makes the manual DFD a powerful tool for requirement validation.

🎯 Final Thoughts on Diagramming

The goal of a Data Flow Diagram is communication. It is a language used to describe how a system works. Whether you use a high-tech platform or a simple pencil, the quality of the communication depends on your understanding of the logic.

By mastering the fundamentals of manual diagramming, you build a foundation that serves you well even when you eventually use advanced software. The tools change, but the logic of data flow remains constant. Start simple. Focus on the flow. Ensure the data is balanced. This approach leads to robust system designs.

Loading

Signing-in 3 seconds...

Signing-up 3 seconds...