 Visual Paradigm Desktop |
  Visual Paradigm Online


Data Flow Diagrams (DFDs) serve as the visual blueprint for information systems. Unlike code, which describes logic through syntax, a DFD describes logic through movement. It maps how data enters a system, transforms through various processes, and exits as output or storage. This guide provides a comprehensive look at constructing these diagrams without relying on proprietary tools, focusing on the fundamental principles of systems analysis.
Whether you are defining requirements for a new application or auditing an existing legacy system, understanding data flow is critical. A well-structured DFD eliminates ambiguity. It forces stakeholders to agree on where information originates and where it terminates. This document explores the anatomy of DFDs, the rules governing their construction, and the methodologies for decomposing complex systems into manageable views.
A Data Flow Diagram is not a control flow diagram. It does not show the timing or sequence of events. Instead, it focuses on the data itself. Think of it as a map of a river system. You do not care about the speed of the water or the weather, you care about the tributaries, the reservoirs, and the mouths of the rivers.
When modeling a business system, the DFD answers three primary questions:
By answering these, you create a logical representation of the business. This representation remains valid regardless of the technology stack used to build the system. It is a language of abstraction that bridges the gap between business needs and technical implementation.
Every Data Flow Diagram is constructed using four specific symbols. While notations vary slightly between methodologies, the underlying concepts remain consistent. Mastery of these elements is the foundation of accurate modeling.
External entities represent sources or destinations of data that exist outside the boundaries of the system being modeled. They are often people, departments, or other systems that interact with the primary system.
In diagrams, these are typically depicted as squares or rectangles. They must always be connected to a process; data cannot simply appear out of nowhere or vanish into thin air.
A process transforms input data into output data. It is the engine of the system. In a DFD, processes are usually shown as circles or rounded rectangles. A process name should always be a verb-noun phrase to indicate action.
Each process must have at least one input and one output. If a process has inputs but no outputs, it is a “black hole”. If it has outputs but no inputs, it is a “miracle”. Both represent modeling errors.
Data stores represent places where information is saved for later retrieval. This could be a database, a file system, a physical filing cabinet, or a temporary buffer. Unlike processes, data stores do not change the data; they hold it.
These are typically drawn as open-ended rectangles or two parallel lines. They connect to processes via data flows, indicating reading or writing operations.
Data flows are the arrows that connect the components. They represent the movement of data between entities, processes, and stores. An arrowhead indicates the direction of movement.
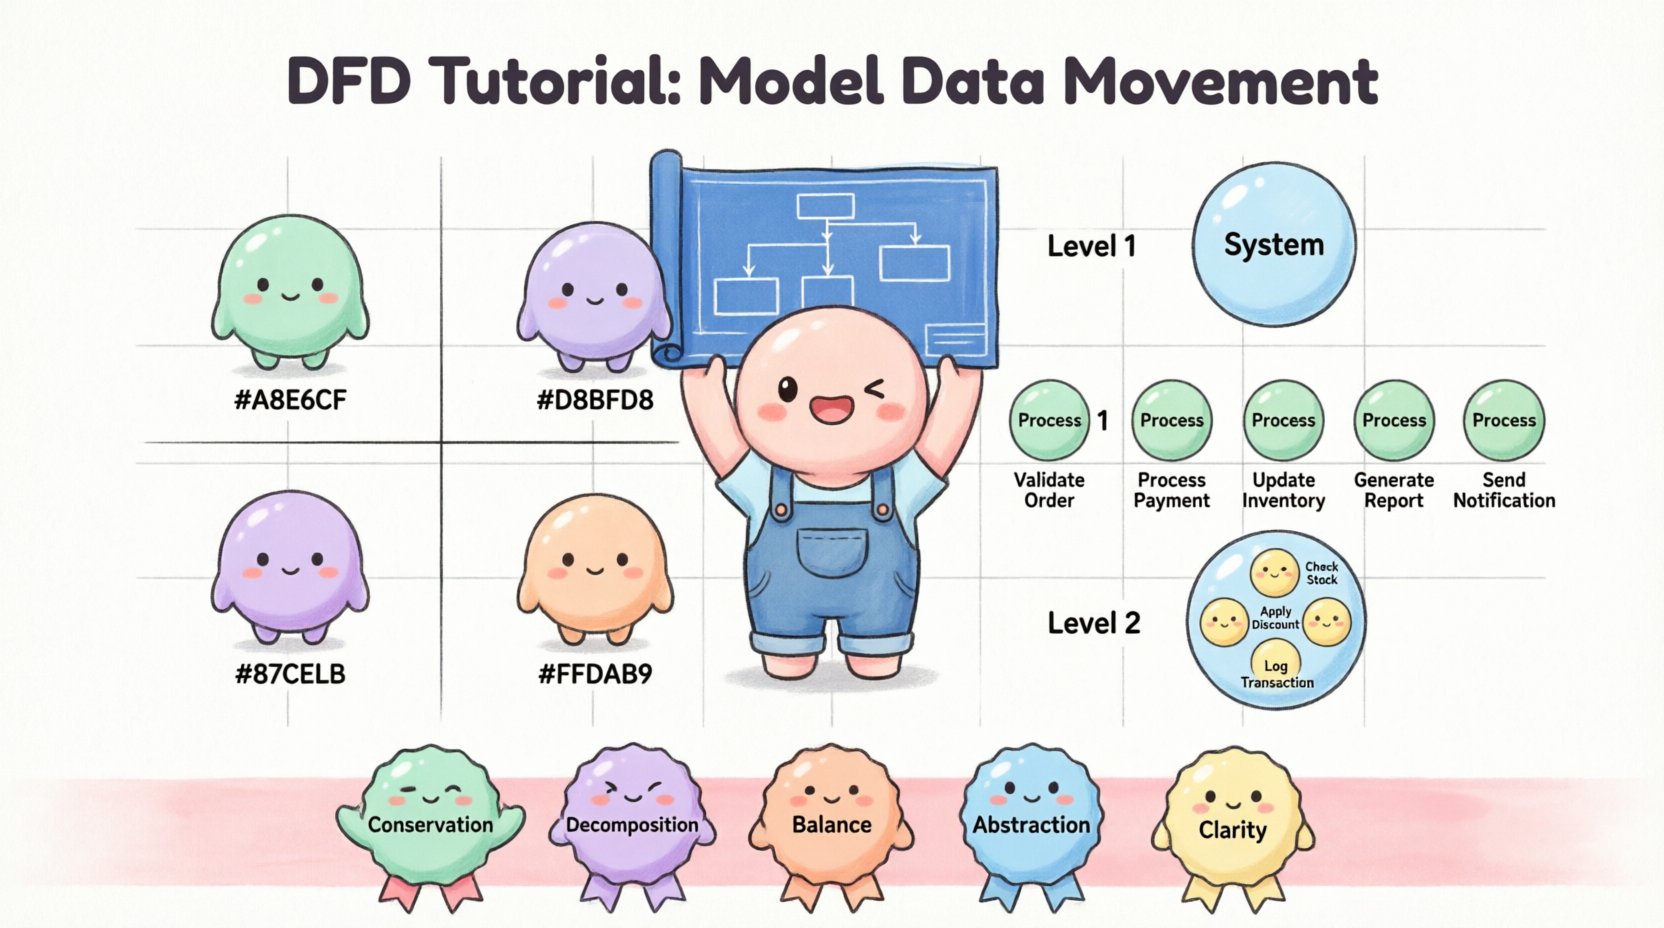
Complex systems cannot be drawn on a single page. To manage complexity, DFDs are decomposed into different levels of detail. This hierarchical approach allows analysts to zoom in and out of the system architecture.
The Context Diagram is the highest level view. It shows the entire system as a single process bubble. It illustrates how the system interacts with external entities.
Level 1 expands the single process from the Context Diagram into major sub-processes. This level identifies the primary functional areas of the system.
Level 2 zooms in on specific processes from Level 1. It breaks down complex functions into smaller, executable steps. This level is often where developers look for specific logic requirements.
There are two dominant notations used in systems analysis. While the logic remains the same, the visual representation differs. Choosing the right one depends on the team’s familiarity and the organization’s standards.
| Feature | Yourdon & DeMarco | Gane & Sarson |
|---|---|---|
| Process Shape | Rounded Rectangle | Rounded Rectangle |
| Entity Shape | Square | Square |
| Data Store Shape | Open Rectangle | Open Rectangle with thicker top/bottom |
| Data Flow Shape | Curved Arrow | Straight Arrow |
| Flow Label Position | Below the line | Above or Below |
The choice between Gane & Sarson and Yourdon & DeMarco is largely cosmetic. However, consistency is vital. Mixing notations within a single document creates confusion and reduces the clarity of the documentation.
Building a DFD is a systematic process. It requires iteration and validation. Follow these steps to ensure accuracy and completeness.
Before drawing a single line, identify what is inside the system and what is outside. This is often determined by the scope of the project. Anything that provides input or receives output is a boundary condition.
List all sources and destinations. Interview stakeholders to determine who interacts with the system. Do not forget automated systems; they are entities just like humans.
Start with the big picture. Draw the system as one bubble. Connect the external entities with arrows. Label the arrows with the data being exchanged. This serves as the anchor for all subsequent diagrams.
Expand the single bubble into Level 1. Identify the major functions. Break the system down into logical chunks. Ensure that the inputs and outputs of the Level 0 diagram match the aggregate inputs and outputs of the Level 1 processes.
Identify where data must be persisted. If a process needs to remember information from a previous transaction, a data store is required. Connect these stores to the relevant processes.
This is a critical rule. The inputs and outputs of a parent process must equal the sum of the inputs and outputs of its children. If the Context Diagram shows “Order Received”, the Level 1 diagram must also show “Order Received” entering the system somewhere.
Walk through the diagram. Trace a piece of data from start to finish. Does it flow logically? Are there any orphaned processes? Are all data flows labeled?
Even experienced analysts make mistakes when constructing these models. Being aware of common errors can save significant time during the review phase.
It is important to distinguish between the logical view of the system and the physical view. The logical DFD describes what the system does. The physical DFD describes how the system does it.
Start with the logical model. Do not introduce technical constraints too early. Introducing technology too early can limit the design options and create bias in the analysis. Once the logical model is approved, the physical model can be derived to guide development.
To ensure the DFDs remain useful throughout the project lifecycle, adhere to these standards.
Why invest time in drawing these diagrams? Textual requirements are prone to misinterpretation. A sentence describing a process can be read in multiple ways. A diagram is visual and spatial.
When a stakeholder sees a diagram, they can immediately spot missing flows. They can see where data is duplicated. They can understand the complexity of the system at a glance. This visual confirmation reduces the risk of building the wrong system.
Furthermore, DFDs serve as a communication tool between business and technical teams. Business analysts use them to understand requirements. Developers use them to understand architecture. By maintaining a shared artifact, the organization reduces silos and improves alignment.
Implementing a Data Flow Diagram methodology requires discipline. It is not enough to draw the lines; you must understand the rules of data conservation and decomposition. As you practice, you will find that the diagrams become a natural extension of your thinking process.
Start small. Model a simple transaction. Then expand to a department. Finally, model the entire enterprise. With each level, your understanding of the system deepens. The goal is not to create a perfect drawing, but to create a clear map of information movement that guides the construction of robust software solutions.
Remember, the diagram is a tool for thinking, not just a document for filing. Use it to challenge assumptions, identify gaps, and validate logic. In the landscape of system design, clarity remains the highest form of precision.
By adhering to these principles, you ensure that the data movement within any business system is documented with precision and understood by all stakeholders involved in the project lifecycle.