 Visual Paradigm Desktop |
  Visual Paradigm Online


A Data Flow Diagram (DFD) is a visual representation of how information moves through a system. It is not about how the system looks, but rather how data is processed, stored, and transmitted. For analysts and architects, mastering this notation is fundamental to understanding complex workflows without getting bogged down in technical implementation details.
This guide breaks down the anatomy of a DFD. We will examine the five core elements that make up these diagrams, explore how they interact, and provide practical examples. By the end, you will understand the structural integrity required to create a clear, actionable system map.
A Data Flow Diagram is a graphical representation of the flow of data through an information system. Unlike a flowchart, which focuses on control logic and decision points, a DFD focuses on data movement. It abstracts the physical implementation to show the logical flow of information.
DFDs are hierarchical. They start with a high-level view and drill down into specific details. This layered approach allows stakeholders to understand the system at a glance while enabling developers to see the specific data requirements.
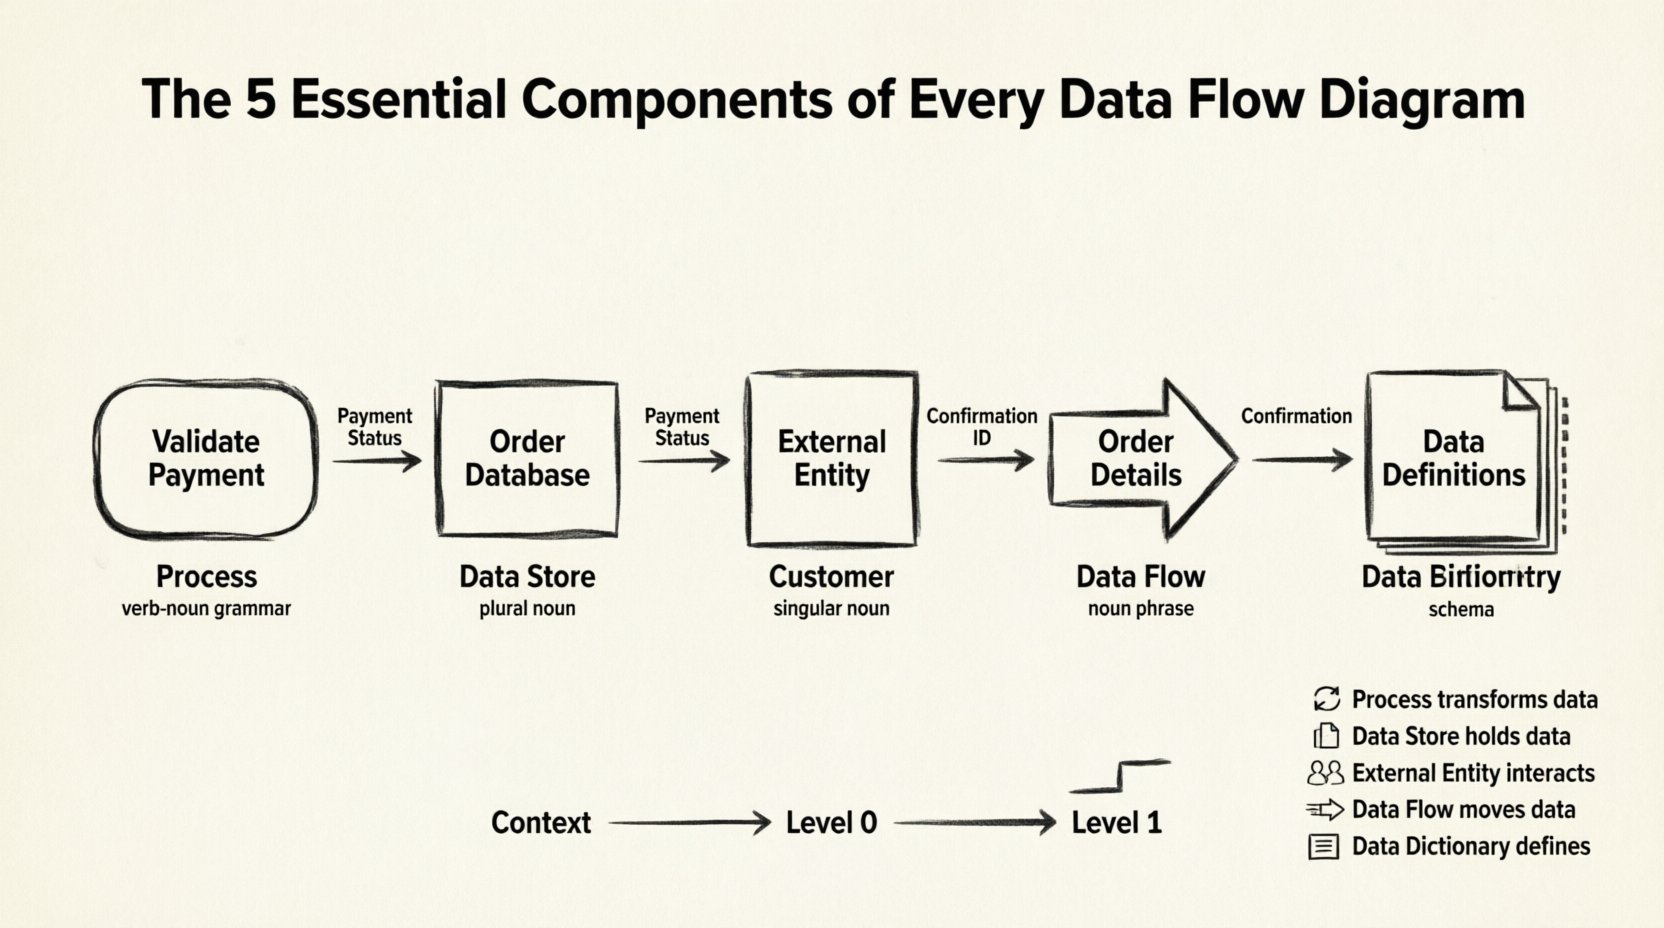
To construct a valid DFD, you must incorporate five specific elements. While the first four are graphical symbols, the fifth is a conceptual requirement essential for accuracy.
A process represents a function that transforms input data into output data. It is the engine of the system. In a DFD, a process is often depicted as a rounded rectangle or a circle, depending on the notation style (Yourdon/DeMarco vs. Gane/Sarson).
Key Characteristics:
Example: Consider an e-commerce system. A process might be “Validate Payment”. It receives credit card data (input) and returns an approval or rejection code (output).
A data store is where information is held for later use. It represents a database, a file, a paper filing cabinet, or any persistence mechanism. Crucially, a data store does not process data; it merely holds it.
Key Characteristics:
Example: In a library system, the “Book Inventory” data store holds the details of available books. It is updated when a book is checked out or returned.
External entities are sources or destinations of data outside the boundary of the system being modeled. They represent people, organizations, or other systems that interact with the main system but are not part of its internal logic.
Key Characteristics:
Example: In a payroll system, the “Employee” is an external entity providing hours worked and receiving a paycheck.
Data flows are the arrows connecting processes, data stores, and external entities. They represent the movement of data. A data flow must have a name that describes the content of the data being transferred.
Key Characteristics:
Example: An arrow connecting the “Login” process to the “User Database” data store would be labeled “Authentication Request”.
While not drawn on the diagram itself, the Data Dictionary is the fifth essential component of a complete DFD specification. It is a centralized repository that defines the structure, type, and format of every data element used in the diagram. Without it, the diagram is ambiguous.
Key Characteristics:
Example: The dictionary might define “Date of Birth” as YYYY-MM-DD with no null values. This prevents logic errors in the processes.
Use this table to quickly reference the properties of each component during your design phase.
| Component | Symbol Shape | Function | Example Label | Grammar Rule |
|---|---|---|---|---|
| Process | Rounded Rectangle / Circle | Transforms Data | Calculate Tax | Verb + Noun |
| Data Store | Open Rectangle / Parallel Lines | Stores Data | Order History | Noun (Plural) |
| External Entity | Square / Rectangle | Source/Sink | Bank System | Noun (Singular) |
| Data Flow | Arrow | Moves Data | Payment Details | Noun Phrase |
| Data Dictionary | Document / List | Defines Data | Data Definitions | Technical Schema |
DFDs are rarely drawn in isolation. They exist in a hierarchy that allows for different levels of abstraction. Understanding these levels ensures that the 5 components are applied correctly at each stage.
This is the highest level view. It shows the entire system as a single process. It identifies the external entities and the major data flows entering or leaving the system.
This diagram explodes the single process from the Context Diagram into major sub-processes. It introduces the first layer of internal data stores and processes.
This level breaks down Level 0 processes into their constituent functions. It is used for detailed design and development.
Creating a DFD is an iterative process. To ensure the diagram remains useful and accurate, adhere to these structural rules.
When you decompose a process into lower levels, the inputs and outputs must remain consistent. If a parent process receives “Order Data,” the child processes must collectively handle that same “Order Data.” You cannot create data from nothing or destroy it.
Consistency is key. Use a standardized naming convention for all components. Avoid abbreviations unless they are universally understood in your organization. Ensure that a data flow labeled “Invoice” in one diagram is not labeled “Bill” in another.
A common mistake is mixing control logic (if/else) into a DFD. DFDs show data movement, not decision logic. Use a decision table or flowchart for control logic. In a DFD, a decision point is represented by a process that outputs different data flows based on the input.
Data stores must have both inputs and outputs unless they are a new creation or an archive. A store that only receives data is a black hole. A store that only provides data is a miracle (creation from nothing). Both violate system logic.
Even experienced modelers make errors. Reviewing these common pitfalls can save time during the analysis phase.
Let’s apply the 5 components to a real-world scenario. Imagine a simplified online ordering system.
DFDs do not exist in a vacuum. They often complement other modeling techniques.
To ensure your Data Flow Diagrams provide value, keep the following principles in mind.
By rigorously applying these five components and adhering to structural rules, you create a robust blueprint for system development. This clarity reduces ambiguity, minimizes rework, and ensures that the final implementation aligns with the intended data architecture.
Remember, a DFD is a living document. As requirements change, the diagram must evolve to reflect the new reality of the system. Regular maintenance of the diagram and its accompanying Data Dictionary is the hallmark of a mature analysis process.