 Visual Paradigm Desktop |
  Visual Paradigm Online


Effective consulting is not about accumulating data; it is about synthesizing information into strategic clarity. A PEST analysis is a foundational tool in the strategist’s toolkit, yet it often falls short when presented as a static list of external factors. Clients do not need to know that inflation is rising; they need to know how that inflation impacts their supply chain margins and pricing power. This guide outlines the process of transforming a standard PEST framework into a high-impact, actionable deliverable that drives decision-making.
When you engage with a client, your role is to bridge the gap between macro-environmental shifts and micro-level business operations. A report that merely categorizes political, economic, social, and technological trends without connecting them to organizational goals will sit in a folder and gather dust. To deliver value, the analysis must be contextualized, prioritized, and tied directly to the client’s strategic objectives.
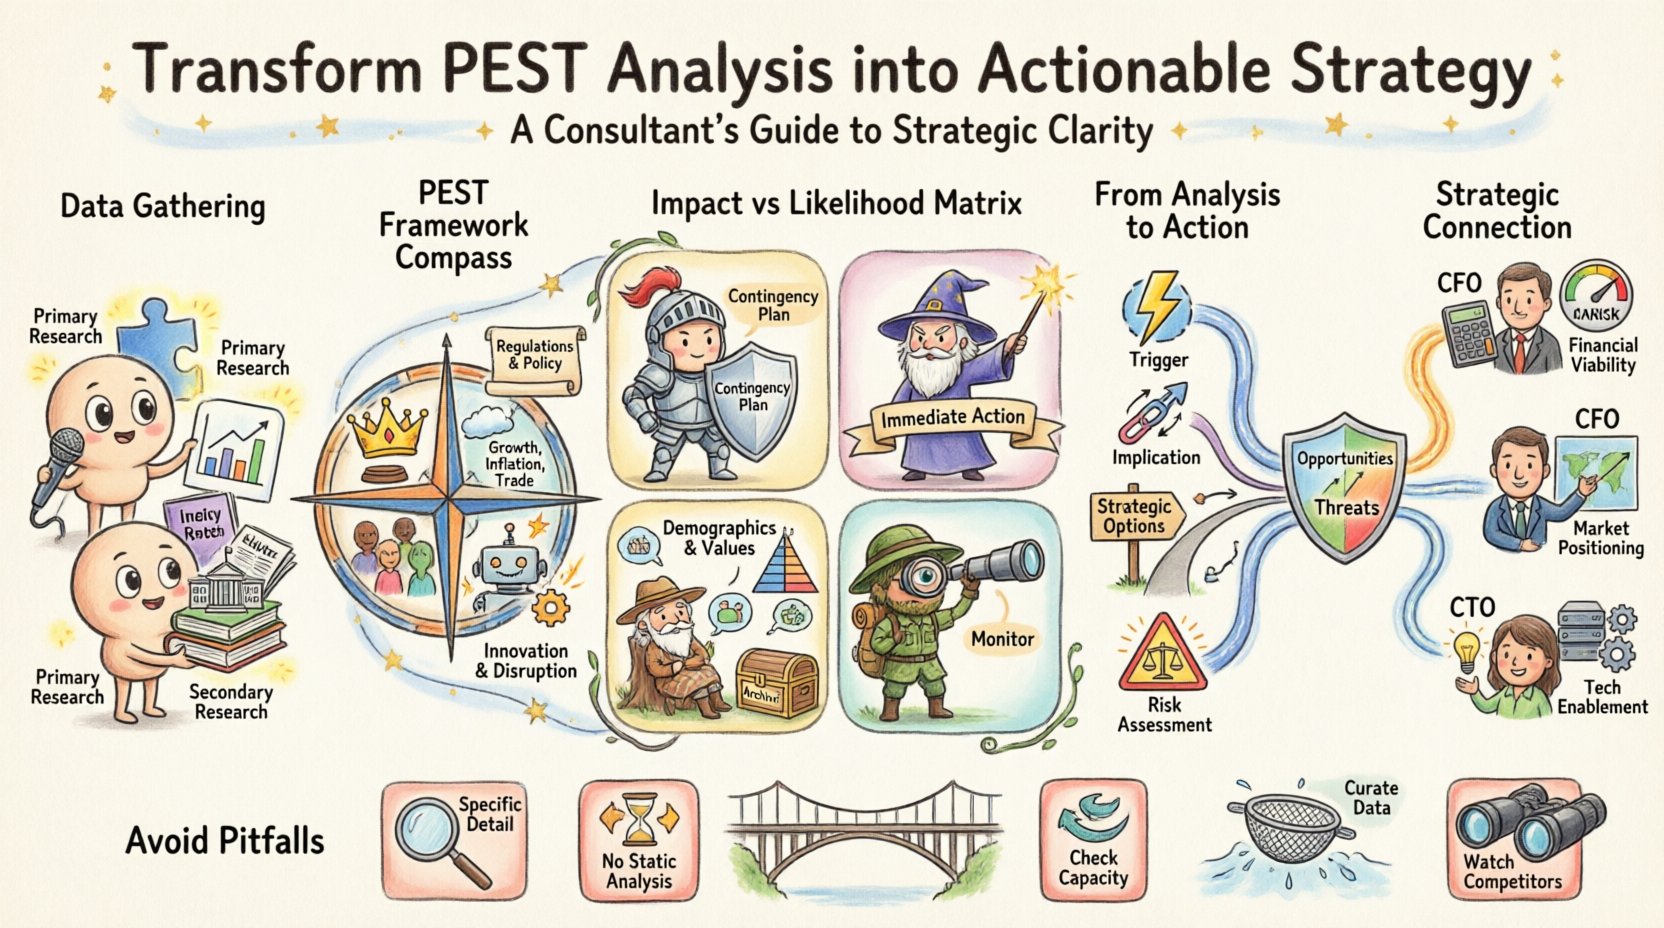
Before structuring the report, we must ensure the analysis itself is rigorous. The PEST framework is simple in name but complex in application. Each letter represents a distinct category of external influence that sits outside the direct control of the organization.
Many consultants make the mistake of treating these categories as silos. In reality, these factors interact. A change in political regulation (Political) might accelerate technological adoption (Technological) due to carbon tax incentives. A strong economic downturn (Economic) might shift social behaviors (Social) toward cost-saving alternatives. Your analysis must reflect these interdependencies.
Quality output depends entirely on the quality of input. Since you cannot rely on proprietary software to aggregate this data, you must rely on rigorous research methodologies. The goal is to find primary and secondary sources that offer credible, up-to-date insights.
A consulting report is a communication tool. If the client cannot navigate it quickly, they cannot absorb the insights. The structure should prioritize the findings that matter most to the client’s specific situation.
Start with a one-page summary. This should not be a table of contents but a narrative of the top three to five findings and their immediate implications. Busy executives need to understand the bottom line before diving into the methodology.
Use tables and charts to break up dense text. A wall of text regarding economic indicators will lose the reader. Instead, present data in a structured format that allows for quick comparison.
| Category | Key Question | Relevance to Client | Data Source |
|---|---|---|---|
| Political | Are there upcoming regulatory changes? | High/Medium/Low | Gov. Policy Database |
| Economic | How does inflation affect margin? | High/Medium/Low | Central Bank Reports |
| Social | What are the demographic shifts? | High/Medium/Low | Census Data |
| Technological | Is automation replacing labor? | High/Medium/Low | Industry Tech Reviews |
Ensure that every table has a clear takeaway. Do not present data for the sake of data. If a trend does not impact the client’s strategy, consider excluding it or placing it in an appendix.
This is the most critical section of the report. The difference between a generic PEST analysis and a consulting-grade deliverable lies here. You must move from What is happening? to So what? and finally to Now what?
Not all external factors are created equal. Some are noise; others are noise-canceling signals. Use a prioritization matrix to rate each finding based on two dimensions:
| Impact | Likelihood | Strategic Action |
|---|---|---|
| High | High | Immediate Action Required |
| High | Low | Contingency Planning |
| Low | High | Maintain Monitoring |
| Low | Low | Acknowledge and Ignore |
Present the client with multiple future states. Instead of predicting one outcome, describe three plausible scenarios based on the PEST findings:
For each scenario, outline the specific strategic responses. This demonstrates that you have thought beyond the current state and prepared the client for volatility.
The report must explicitly link external factors to internal strategic pillars. If the client is focused on market share growth, how do the social trends support or hinder that goal? If the client is focused on cost leadership, how do economic factors threaten their margin structure?
While a standalone PEST report has value, integrating these findings into a SWOT analysis strengthens the argument. The PEST factors become the Opportunities and Threats in the SWOT matrix. This ensures that the external analysis feeds directly into the internal strategy discussion.
Every recommendation should follow a logical flow:
This structure removes ambiguity. It forces the consultant to own the logic behind the recommendation.
The delivery of the report is as important as the content. How you present the findings determines how they are received.
Do not use the same deck for every client. A CFO cares about risk and margin. A CEO cares about growth and market position. A CTO cares about technological obsolescence. Adjust the emphasis of the PEST report based on the audience.
Do not simply hand over a document. Schedule a workshop where you walk the client through the analysis. Ask them to validate the findings. This creates a sense of ownership. If they agree with the analysis, they are more likely to agree with the recommendations.
Clients may disagree with your interpretation of the data. They might feel that a political risk is overstated. Listen to their internal knowledge. Often, they have insights that your public research missed. If their data contradicts yours, adjust the report. Credibility is built on accuracy, not on stubbornness.
Even experienced consultants make mistakes when applying the PEST framework. Being aware of common errors helps maintain the quality of the deliverable.
Strategy is not a one-time event. The environment changes, and so must the analysis. Build a system for periodic review.
The goal of a consulting engagement is to leave the client better equipped to navigate their market than when you arrived. A PEST report that sits in a drawer has failed. A report that sparks a strategy session, influences a budget allocation, or alters a product roadmap has succeeded.
Focus on clarity, relevance, and action. Ensure every finding has a purpose. Ensure every recommendation has a basis in evidence. By treating the PEST analysis as a dynamic tool rather than a static exercise, you position yourself as a strategic partner rather than a data provider.
Remember that the value lies in the connection between the external world and the internal decision-making process. When you master this connection, you provide insights that are not just interesting, but essential.