 Visual Paradigm Desktop |
  Visual Paradigm Online


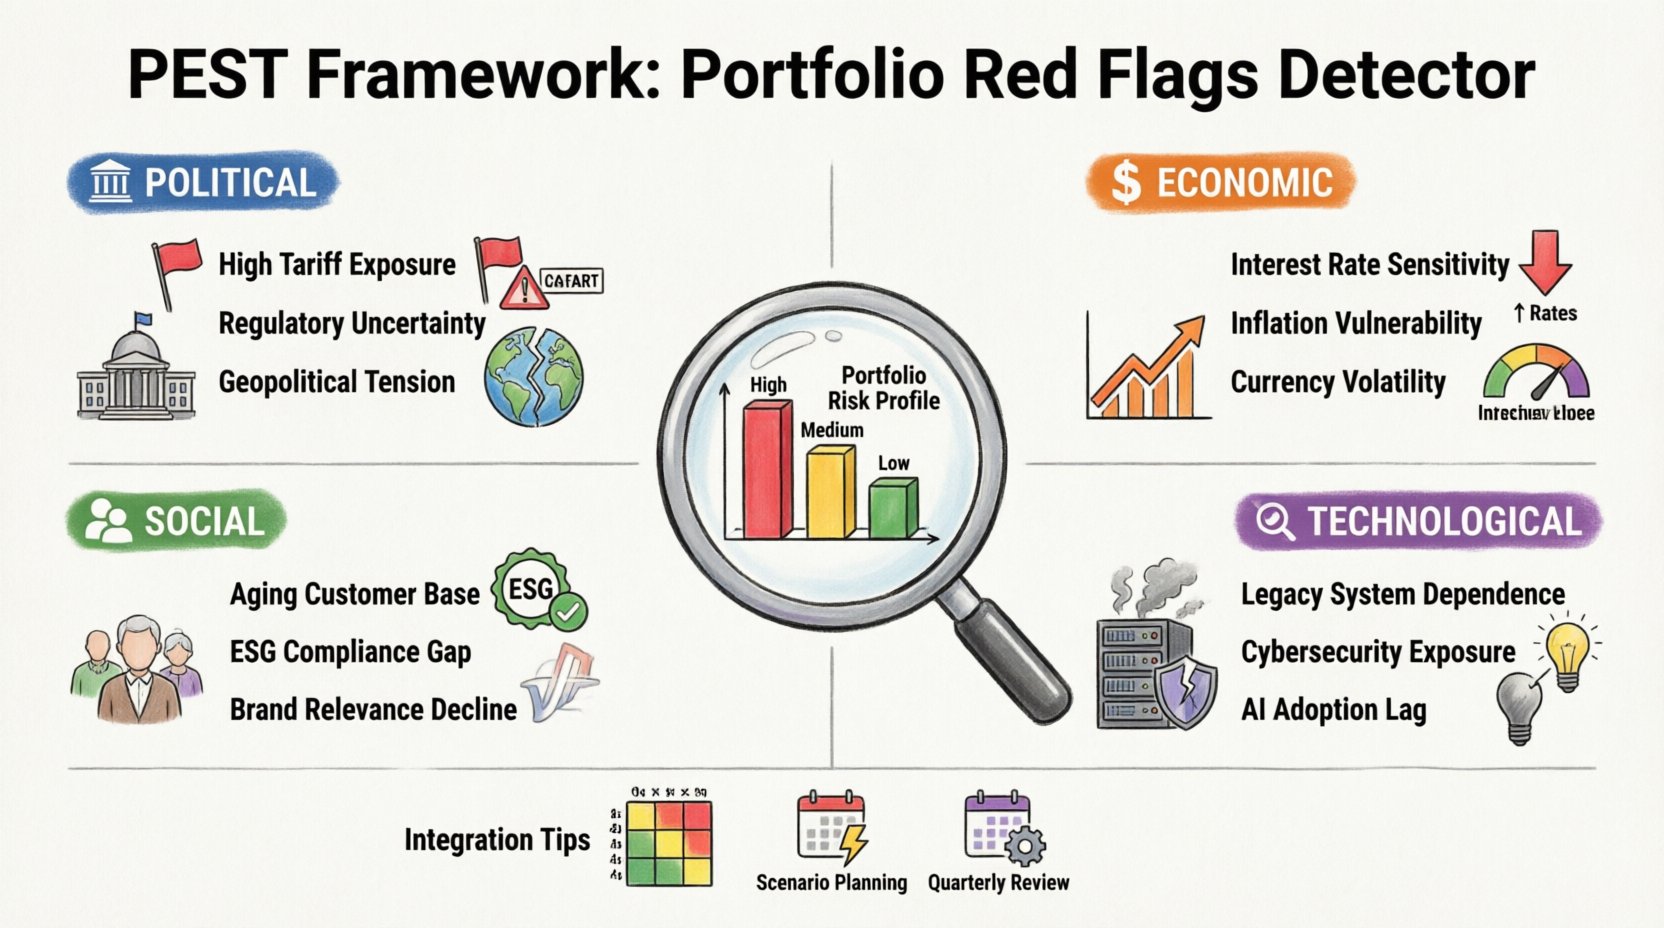
Investing is rarely a closed system. External forces constantly reshape the landscape where assets grow, shrink, or vanish. A robust portfolio management strategy requires more than just analyzing balance sheets and earnings reports. It demands a macro view of the environment in which those assets operate. This is where the PEST framework becomes an essential tool for due diligence. By systematically evaluating Political, Economic, Social, and Technological factors, investors can spot potential risks before they materialize into significant losses.
Many professionals focus heavily on internal metrics while overlooking the broader context. This oversight often leads to unexpected volatility. Understanding how external pressures influence specific sectors allows for better risk mitigation. This guide explores how to apply PEST analysis to identify red flags in investment portfolios. We will break down each component, provide actionable indicators to watch, and explain how to integrate these insights into your decision-making process.
Political stability is the bedrock of long-term investment confidence. When governments change policies abruptly or engage in geopolitical conflict, markets react with volatility. For portfolio managers, the Political component of PEST analysis focuses on legislation, trade barriers, and geopolitical relations.
When reviewing your portfolio, look for companies that are overly dependent on government contracts or specific trade routes. A sudden change in administration can lead to contract cancellations. Similarly, companies importing raw materials from unstable regions face supply chain risks that internal analysis might miss.
Consider the energy sector. A shift in climate policy can render certain fossil fuel assets stranded. Conversely, a company positioned for green energy transition might benefit from subsidies. The key is to map your holdings against current legislative agendas.
| Political Factor | Portfolio Impact | Warning Sign |
|---|---|---|
| Trade Tariffs | Increased input costs | Heavy reliance on imports from targeted regions |
| Tax Policy | Reduced net profit | High effective tax rate or reliance on tax credits |
| Regulation | Compliance costs | History of fines or pending litigation |
| Geopolitics | Supply disruption | Sole sourcing from conflict zones |
Economic conditions dictate the purchasing power of consumers and the cost of capital for businesses. Unlike political factors, economic trends often follow cycles, but the timing and severity can vary. Analyzing the Economic component helps determine if a portfolio is aligned with the current phase of the business cycle.
During periods of rising interest rates, debt-heavy companies face significant pressure. If your portfolio contains many leveraged entities, this is a major red flag. Similarly, high inflation hurts fixed-income assets while potentially boosting commodities.
Economic analysis also requires looking at global interconnectivity. A slowdown in a major economy like China or the United States can ripple through supply chains globally. Diversification across geographies helps mitigate this, but it does not eliminate systemic risk.
Social forces shape consumer demand and labor availability. Shifts in population demographics, cultural values, and lifestyle trends can make certain industries obsolete while creating new opportunities. Ignoring these trends often leads to holding assets that are heading toward decline.
Companies that fail to adapt to changing social norms risk losing market share. For instance, retailers that ignore e-commerce trends or food companies that ignore health consciousness face headwinds.
Consider the shift toward remote work. Commercial real estate portfolios face long-term challenges as office vacancy rates rise. Meanwhile, technology infrastructure investments become more critical. Social analysis is about predicting behavior changes before they hit the bottom line.
Technology drives efficiency but also disruption. The pace of innovation means that competitive advantages can evaporate quickly. The Technological component of PEST analysis assesses how new inventions, automation, and digital shifts impact the viability of current business models.
Disruption is the biggest threat here. A company might be profitable today but irrelevant in five years if it ignores technological shifts.
For example, the automotive industry is undergoing a massive shift toward electric vehicles. Traditional manufacturing portfolios must account for the risk of internal combustion engine assets becoming stranded. Similarly, media companies face disruption from streaming algorithms.
Identifying red flags is only the first step. The value lies in integrating these insights into your broader strategy. This requires a structured approach to monitoring and adjustment.
Map your holdings against the four PEST categories. Assign a risk level to each holding based on the factors identified above. This visual aid helps prioritize which assets require immediate attention.
Develop scenarios based on potential PEST changes. What happens if interest rates rise by 2%? What if a new trade war begins? Stress testing your portfolio against these scenarios reveals hidden vulnerabilities.
PEST analysis is not a one-time task. External factors evolve continuously. Establish a quarterly review schedule to update your analysis.
Even with a structured framework, errors can occur. Being aware of common mistakes ensures your analysis remains accurate and useful.
Building a resilient portfolio requires looking beyond the numbers. The PEST framework provides a structured way to scan the horizon for potential risks. By systematically evaluating Political, Economic, Social, and Technological factors, you can identify red flags that traditional financial analysis might miss.
Consistency is key. Regular monitoring and honest assessment of your holdings against these external forces allow for proactive adjustments rather than reactive damage control. The goal is not to predict the future perfectly, but to prepare for multiple possibilities. This approach fosters a portfolio that can withstand volatility and capitalize on emerging opportunities.
Remember that risk management is an ongoing process. As the world changes, your analysis must evolve. Staying informed and adaptable ensures your investment strategy remains robust in an uncertain environment.