 Visual Paradigm Desktop |
  Visual Paradigm Online


Software systems are living organisms. They grow, evolve, and occasionally change direction based on market demands or technical constraints. In the early stages of development, a Use Case Diagram serves as a critical blueprint. It maps out interactions between actors and the system, defining functional requirements visually. However, these diagrams are static representations of dynamic processes. Over time, the gap between the diagram and the actual software widens. When this disconnect becomes significant, the diagram ceases to be a guide and becomes a source of confusion.
Recognizing when a diagram requires a reset is a skill that prevents technical debt from accumulating silently. This guide explores the indicators of diagram decay, the consequences of ignoring them, and the methodology for restoring clarity to your system architecture documentation. We will look at how to maintain alignment between visual models and implementation reality without relying on specific tools or vendors.
A Use Case Diagram is not a one-time artifact created at the start of a project. It is a document that should reflect the current state of the system. In many organizations, the diagram is created during the requirements gathering phase and then filed away. As developers write code and stakeholders request new features, the codebase changes, but the diagram remains untouched.
This divergence creates a scenario known as “diagram drift.” When the documentation no longer matches the product, it loses credibility. Teams stop looking at it, which leads to inconsistent implementations. To prevent this, one must understand the lifecycle:
Most projects stall at the Implementation or Maintenance phase. They neglect the Decay phase until it becomes a critical issue. Identifying the signs of decay is the first step toward a successful reset.
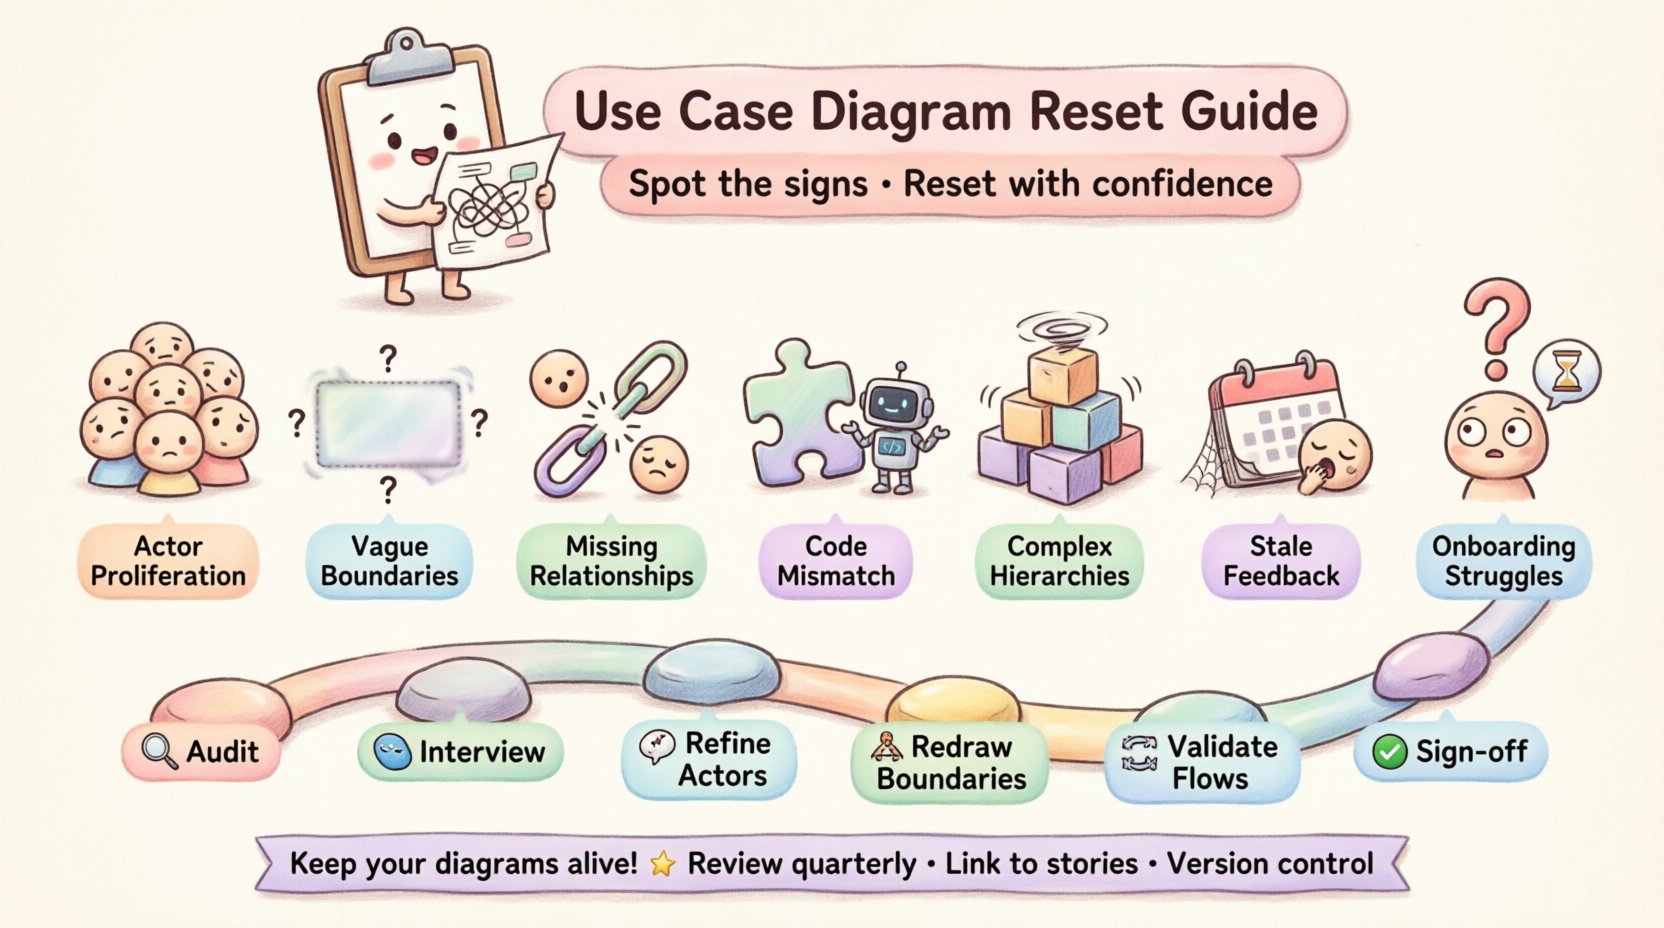
How do you know if the diagram is failing? It is rarely obvious until a major feature request causes confusion. However, there are specific visual and structural patterns that indicate the model is out of sync with reality. If you observe these signs, it is time to pause and evaluate the documentation.
Actors represent roles that interact with the system, not specific individuals. When a diagram shows dozens of specific roles (e.g., “Sales Manager,” “Senior Sales Manager,” “Junior Sales Manager”), it indicates a failure to generalize. This makes the diagram cluttered and difficult to maintain. If adding a new user type requires a new actor symbol, the abstraction level is too low. A healthy diagram groups responsibilities into meaningful roles.
The rectangle representing the system boundary should clearly define what is inside and what is outside. If use cases cross the line ambiguously, or if external systems are drawn without clear distinction, the scope is undefined. This leads to developers assuming responsibility for features that are actually handled by third-party services or legacy systems. A reset is needed when the boundary no longer protects the scope of the current project.
Relationships like <<include>> and <<extend>> are powerful tools for managing complexity. However, if every use case connects to every other use case with a simple association line, the diagram becomes a spaghetti mess. Conversely, if relationships are missing where logic dictates they should exist, the flow of data is unclear. A lack of proper relationship modeling suggests the diagram is a checklist rather than a functional map.
This is the most direct sign of failure. If developers are implementing features that are not represented in the diagram, or if documented features are missing from the application, the model is broken. This often happens when the diagram is treated as a legal document rather than a design aid. The code wins, and the diagram becomes fiction.
Use Case Diagrams are meant to be high-level views. If the diagram attempts to show detailed step-by-step logic within the boxes, it is failing its purpose. Detailed flows belong in Sequence Diagrams or Activity Diagrams. When the Use Case Diagram becomes a narrative script, it overwhelms the reader. A reset involves moving detailed logic to separate diagrams.
If the team has not reviewed the diagram with business stakeholders in over a year, it is likely outdated. Business rules change. Compliance requirements shift. If the diagram does not reflect current business policies, it is useless for validation. A lack of recent sign-off indicates the diagram is no longer a trusted source of truth.
The best metric for documentation health is onboarding time. If new developers or analysts spend weeks deciphering the diagram to understand the system, the diagram is too complex or inaccurate. A clear diagram should allow a knowledgeable person to understand the system’s intent within hours. If it takes weeks, the diagram is failing its communication role.
| Sign of Failure | Immediate Impact | Long-term Consequence |
|---|---|---|
| Excessive Actor Proliferation | Confusion over permissions | Security vulnerabilities due to role ambiguity |
| Vague System Boundaries | Scope creep during development | Budget overruns and missed deadlines |
| Missing Relationships | Broken workflows in testing | Recurring bugs in production |
| Discrepancy with Code | Redundant development effort | Technical debt accumulation |
| Overly Complex Hierarchies | Analysis paralysis | Features delayed due to design review bottlenecks |
| Stale Stakeholder Feedback | Build of unwanted features | Low user adoption rates |
| Onboarding Difficulties | Slower team velocity | High turnover and knowledge silos |
Some teams operate under the assumption that diagrams are optional or that code is the only documentation that matters. While code is the ultimate truth, it is not always readable or understandable at a high level. Ignoring a failing Use Case Diagram carries significant costs:
Therefore, recognizing the need for a reset is not just a technical exercise; it is a risk management strategy. The effort to update the diagram is an investment in system stability.
Once you have identified the signs of failure, the next step is the reset. This is not merely editing existing boxes; it is often a reconstruction. The goal is to align the model with the current reality of the software.
Before making changes, you must understand the current state. Walk through the existing diagram line by line. Mark every element that feels uncertain. Ask the following questions for each use case:
Create a list of items to keep, items to delete, and items to modify. This audit phase provides the raw data needed for the reset.
Do not rely on the diagram to tell you what the system does. Talk to the people who use it. Interview product managers, senior developers, and key users. Ask them to describe their workflows. Compare their descriptions to the diagram. Gaps in this comparison highlight where the diagram has failed.
Focus on:
During the reset, simplify the actors. Merge similar roles into broader categories. Ensure every actor represents a distinct responsibility. Remove internal system processes that have been misclassified as external actors. This reduces clutter and improves the high-level view.
Redraw the system boundary based on the current architecture. Ensure that all external dependencies are clearly marked. If the system now integrates with cloud services or third-party APIs, these should be represented as external actors or systems, not internal use cases.
Review the connections between use cases. Ensure that <<include>> and <<extend>> relationships are used correctly. <<include>> should be used when a behavior is always part of a larger behavior. <<extend>> should be used for optional or conditional behavior. Correcting these relationships clarifies the logic flow without cluttering the diagram.
Once the reset is complete, present the new diagram to the stakeholders. This is a formal approval step. Do not assume they know what you changed. Walk them through the significant modifications. Get their explicit confirmation that the diagram now reflects the system. This sign-off is crucial for future accountability.
A reset solves the immediate problem, but it does not prevent future decay. To keep the diagram useful, you must integrate it into the development lifecycle. Here are strategies to maintain diagram health:
While resetting, teams often make mistakes that lead to quick re-decay. Be aware of these common traps:
Investing time in resetting a Use Case Diagram yields returns in clarity and efficiency. A clean model allows new team members to understand the system quickly. It helps stakeholders visualize the scope before development begins. It provides a baseline for testing and validation.
When the diagram accurately reflects the system, it becomes a communication hub. It aligns the technical team with the business goals. It reduces the friction of change. In an environment where requirements shift constantly, having a reliable map is essential for navigation.
Do not let the diagram become a relic of the past. Treat it as a living document. When the signs of failure appear, act quickly. A reset is not an admission of failure; it is a commitment to quality. By maintaining an accurate Use Case Diagram, you ensure that the architecture of your software remains understandable, maintainable, and aligned with the needs of the users.
Take the time to audit, interview, and refactor. The effort spent on the diagram is an effort spent on the product itself. In the end, clear documentation is a hallmark of a mature engineering team. It shows discipline, foresight, and a respect for the complexity of the systems being built.