 Visual Paradigm Desktop |
  Visual Paradigm Online


Creating a visual representation of system functionality is a fundamental skill for any analyst or developer. A Use Case Diagram offers a high-level view of how users interact with a system. It bridges the gap between technical implementation and business requirements. This guide walks you through the process of drafting your first diagram efficiently, focusing on clarity and structure rather than software features.
Whether you are documenting a new application or analyzing an existing process, understanding the actors and their goals is essential. This tutorial provides a structured approach to mapping these interactions without getting bogged down in complex interfaces. We will focus on the core concepts, the relationships between elements, and a practical workflow you can apply immediately.
A Use Case Diagram is a visual model used in software engineering and systems analysis. It illustrates the interactions between external entities and the system itself. The primary purpose is to define the functional requirements of a system. It answers the question: “What can the system do for the user?”
Unlike detailed flowcharts or sequence diagrams, this type of diagram remains abstract. It does not show the internal logic or the sequence of steps within a specific function. Instead, it highlights the goals and the actors who achieve them. This abstraction makes it an excellent tool for communication with stakeholders who may not understand technical code.
Key benefits include:
Before drawing lines and shapes, you must understand the building blocks. Every diagram consists of specific elements that convey meaning when connected correctly. Missing components can lead to ambiguity in the requirements.
An actor represents a role that interacts with the system. It is not necessarily a specific person, but rather a job title or a role. For example, “Admin” is an actor, not “John Doe”.
Visually, actors are often depicted as stick figures. However, the symbol itself is less important than the label. Consistency is key to readability.
A use case represents a specific goal or function that the system performs. It is a complete unit of functionality. If a user clicks a button to perform an action, that action is a use case.
The system boundary is a box that encloses all use cases. It defines the scope of the project. Everything inside the box belongs to the system. Everything outside is external.
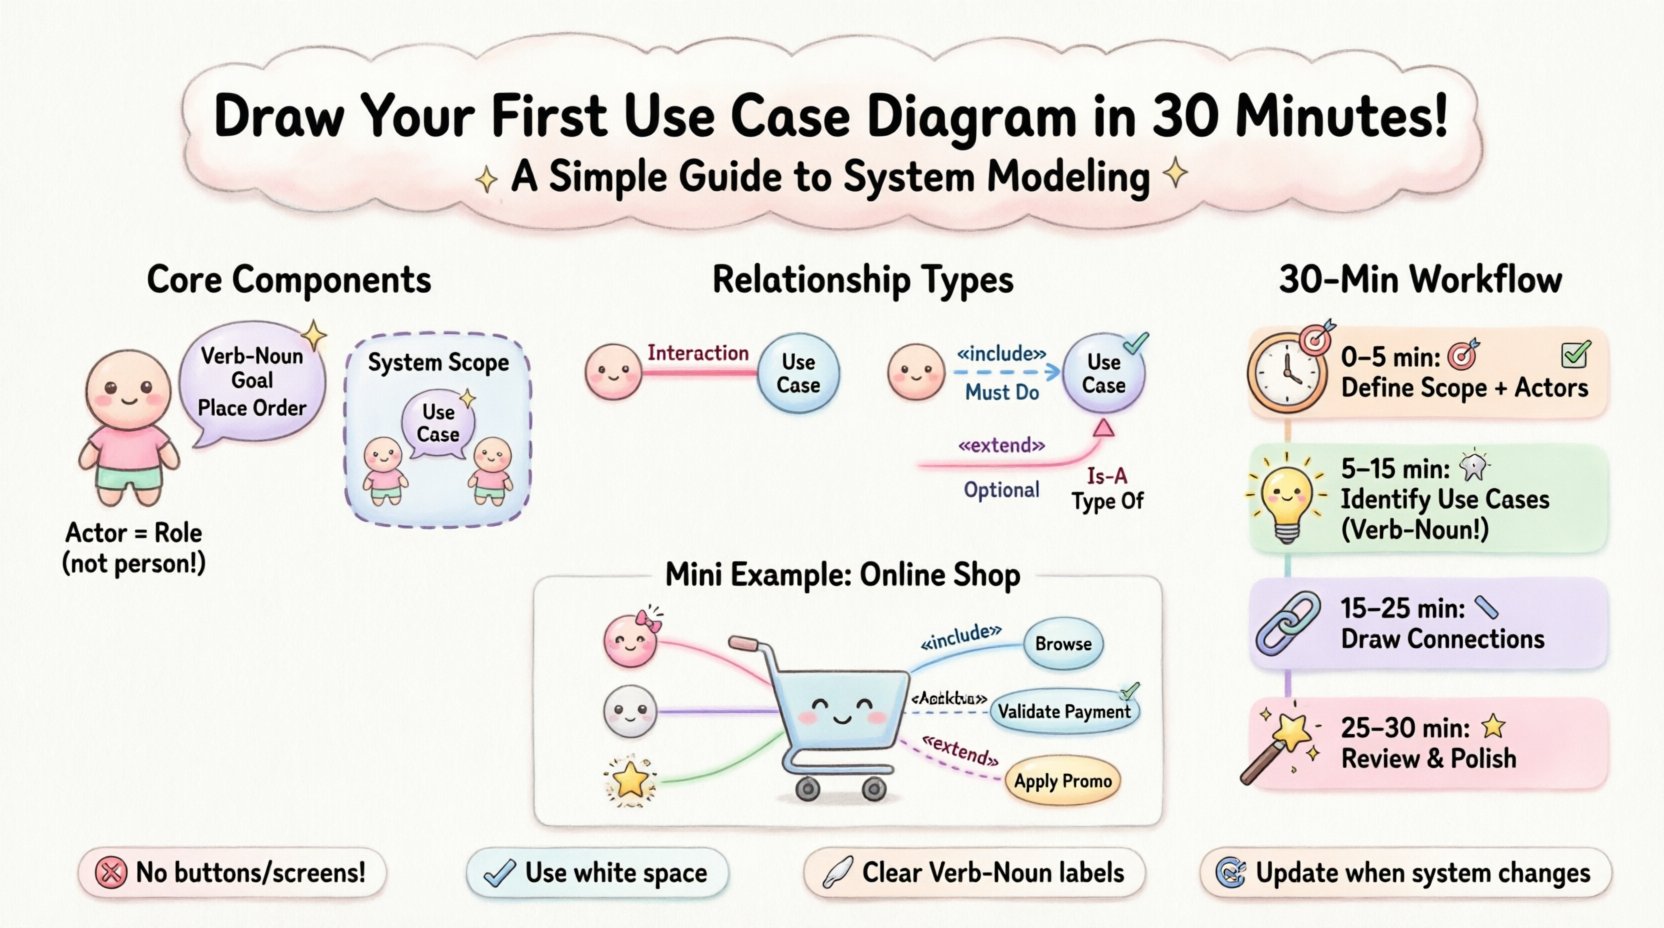
The power of the diagram lies in the lines connecting actors and use cases. These lines define how the interaction happens. There are four main types of relationships to master. Understanding the distinction between them is critical for accurate modeling.
This is a standard communication link between an actor and a use case. It implies that the actor initiates or participates in the use case. A solid line is typically used.
This relationship indicates that one use case must call another use case to complete its function. It is a mandatory dependency. Think of it as “must do”.
This relationship indicates that one use case may add functionality to another under specific conditions. It is optional. Think of it as “might do”.
This relationship represents inheritance. A specific actor or use case is a specialized version of a general one. It is drawn with a solid line and a triangle arrowhead.
| Relationship | Direction | Meaning | Visual Indicator |
|---|---|---|---|
| Association | Actor → Use Case | Interaction exists | Solid Line |
| Include | Base → Included | Mandatory function | Dashed Line + «include» |
| Extend | Extending → Base | Optional function | Dashed Line + «extend» |
| Generalization | Specific → General | Inheritance | Solid Line + Triangle |
You do not need hours to draft a high-quality diagram. With a focused approach, you can create a clear model in half an hour. Follow this step-by-step process to ensure you cover all necessary aspects without getting stuck.
Start by identifying the system boundary. Draw a simple rectangle. Write the name of the system in the center. Now, list all the roles that interact with this system. Ask yourself: Who starts the process? Who receives the result?
For each actor, ask: “What is the goal of this actor?” Write down every distinct goal as a use case. Place these ellipses inside the rectangle.
Now, link the actors to the use cases. Draw solid lines for direct interactions. Look for common functionality across multiple use cases.
Step back and review the diagram. Does it tell the story of the system?
To make this concrete, let’s walk through a simple scenario: an Online Shopping Platform. This example demonstrates how to apply the concepts practically.
Who interacts with the store?
What can they do?
How do they interact?
Even experienced practitioners make errors when modeling. Being aware of these pitfalls will save you time during the review process.
Do not draw buttons, screens, or database tables. A Use Case Diagram is about what the system does, not how it does it. Avoid terms like “Click Submit Button”.
If you have ten actors, the diagram becomes a spiderweb. Consolidate similar roles. If “Manager” and “Supervisor” do the same tasks, group them under “Staff”.
These relationships add complexity. Use them only when necessary. If a function is simple, just draw a direct association. Don’t force a relationship where a line suffices.
If a use case sits outside the box, it implies the system doesn’t do it. If an actor sits inside, it implies the actor is part of the system. Keep the boundary strict.
Avoid vague names like “Do Something” or “System Function”. Specificity aids understanding. Use “Generate Report” instead of “Process Data”.
A diagram is useless if stakeholders cannot read it. Follow these guidelines to ensure your work is professional and easy to digest.
Once the drawing is complete, the real work begins: analysis. A diagram is not just a picture; it is a tool for discovery.
Compare the diagram against stakeholder interviews. Are there goals mentioned in meetings that are missing from the diagram? If so, add them. This step often reveals hidden requirements.
Every use case should have corresponding test scenarios. If you have “Place Order”, you need tests for successful placement, failed payment, and empty cart. The diagram drives your quality assurance process.
If you plan to change a feature, look at the diagram. Which actors are affected? Which other use cases depend on this one? This visual dependency map prevents accidental breakage during updates.
A Use Case Diagram rarely stands alone. It is part of a larger documentation suite. Understanding where it fits helps in maintaining consistency.
By keeping these models aligned, you ensure that the high-level goals match the low-level code. This alignment reduces the risk of scope creep and miscommunication.
Creating a Use Case Diagram is a disciplined exercise in thinking about user value. It forces you to step away from code and focus on the human element of the software. By following the steps outlined here, you can produce a clear, actionable model in a short timeframe.
Remember that the goal is communication. If a stakeholder looks at your diagram and understands the system’s purpose, you have succeeded. Keep the lines simple, the labels clear, and the focus on the user’s goals. As you gain experience, you will find that this skill becomes second nature, streamlining your entire development lifecycle.
Start small, iterate often, and let the diagram guide your requirements. The clarity you bring to the project now will pay dividends when the system is built and maintained later.