 Visual Paradigm Desktop |
  Visual Paradigm Online


In complex systems engineering, the distance between a detailed model and a strategic decision can feel insurmountable. Executives do not need to see every connection or parameter. They need clarity, risk visibility, and alignment with business goals. This guide explores how to design SysML viewpoints that bridge this gap effectively.
Systems engineering models are inherently rich. They capture structure, behavior, requirements, and parameters. However, richness often translates to noise when presented to non-technical leadership. A full model can overwhelm decision-makers, obscuring critical paths and potential risks.
The solution lies in the concept of viewpoints. A viewpoint is not just a view; it is a specification of the concerns relevant to a specific set of stakeholders. By filtering the model through a viewpoint, you present only the information necessary for a specific decision-making context.
When designing for executives, the goal is not simplification in the sense of removal, but abstraction in the sense of relevance. You are translating technical fidelity into business intelligence.
A SysML viewpoint defines a specific perspective on a system model. It specifies:
This aligns with the ISO/IEC/IEEE 42010 standard for architecture description. While the standard focuses on architecture, the principles apply directly to SysML modeling. A viewpoint ensures consistency. If every stakeholder receives a view that matches their concern set, the organization avoids the confusion of mixed signals.
To design effective viewpoints, you must understand what drives executive decisions. Executives are generally focused on three core domains:
A technical model contains all this data, but it is buried. For example, a Block Definition Diagram (BDD) shows component hierarchy. An executive needs to know if that hierarchy represents cost centers or if it introduces single points of failure. A parametric diagram shows constraints. An executive needs to know if constraints are being met or if there is a margin for error.
Your viewpoint must surface these specific indicators. It should not hide the data, but it should prioritize the data that influences the decision.
Creating a viewpoint requires discipline. The following principles ensure the resulting communication is effective and maintainable.
Executives operate at a higher level of abstraction than engineers. You must aggregate data. Instead of showing 50 individual sensors, show the “Sensor Subsystem” and its aggregate reliability metric. This reduces cognitive load without losing the essence of the information.
Every viewpoint must use a consistent visual language. If one diagram uses color to indicate risk, all executive diagrams must use the same color scheme. Changing conventions creates friction and reduces trust in the model.
Executives need to know if a requirement is met. The viewpoint should show the link between a business requirement and the system element that satisfies it. This is often a high-level traceability link, not a detailed derivation.
Projects evolve. A viewpoint designed for the concept phase may not work for the production phase. The design of the viewpoint must account for the lifecycle stage of the project. Early stages focus on capability and scope. Later stages focus on cost and schedule.
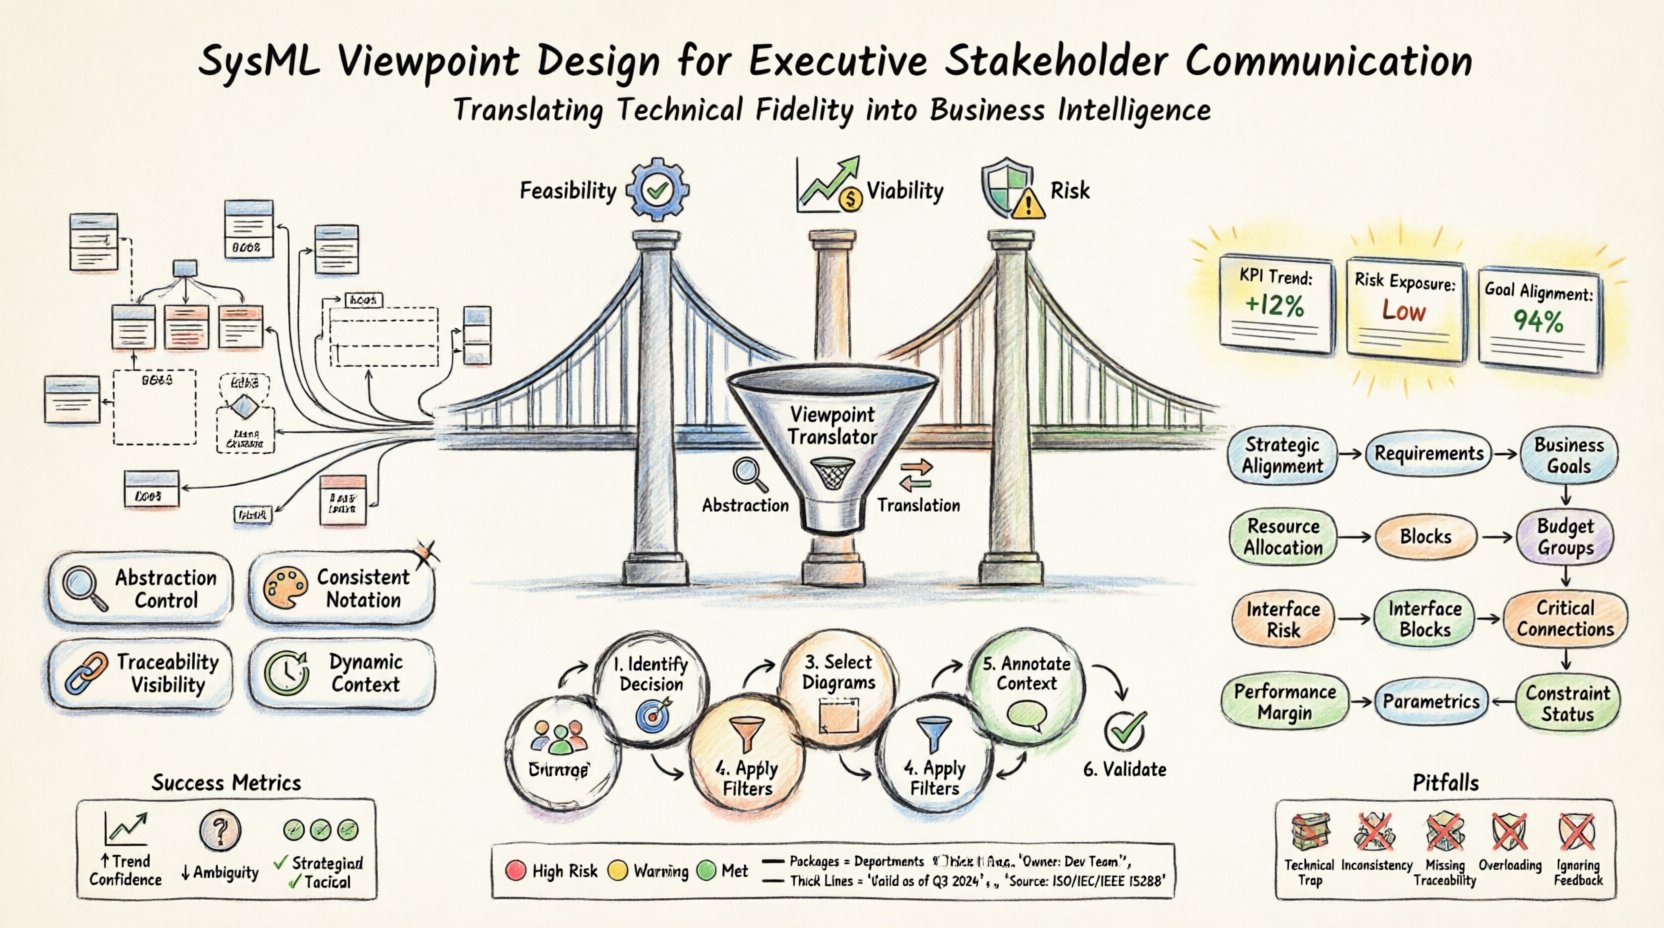
Below is a structured overview of common executive concerns and the corresponding SysML elements required to address them.
| Stakeholder Concern | Required SysML Element | Viewpoint Focus |
|---|---|---|
| Strategic Alignment | Requirements | Link business goals to system capabilities. |
| Resource Allocation | Blocks (Packages) | Group elements by budget or organizational unit. |
| Interface Risk | Interface Blocks | Highlight external dependencies and critical connections. |
| Performance Margin | Parametric Diagrams | Show constraint satisfaction status and margins. |
| Operational Flow | Activity Diagrams | Summarize critical path and decision points. |
| Change Impact | Traceability Links | Visualize the ripple effect of a requirement change. |
Building these views requires a systematic approach. Follow these steps to ensure the resulting viewpoint serves its purpose.
Start with the end in mind. What decision will be made using this view? Is it a go/no-go milestone? Is it a budget approval? The decision dictates the data required.
Determine the boundaries of the model relevant to the decision. Do not include legacy systems unless they interact directly. Do not include internal details of third-party components unless the interface is critical.
Choose the SysML diagrams that best represent the data. For high-level structure, use Block Definition Diagrams. For flow and logic, use Activity Diagrams. For constraints, use Parametric Diagrams. Avoid showing all diagrams at once.
Filter out elements that do not contribute to the decision. Hide internal logic. Hide implementation details. Show only the external interfaces and the critical internal blocks that drive the outcome.
Add notes that explain the data. A diagram of a risk threshold needs a legend. A schedule view needs a timeline reference. Context transforms data into information.
Present the draft viewpoint to the executives. Ask if the view answers their questions. If they ask for data you did not include, you have identified a gap in your filtering strategy.
The visual representation of a SysML model matters. Executives scan for patterns. Use visual cues to guide their attention.
Consistency is key. If red means “High Risk” in the first slide, it must mean “High Risk” in the tenth slide. Confusion in notation leads to confusion in judgment.
Even with a solid plan, pitfalls can undermine the effectiveness of your viewpoints.
Engineers often design views that are too detailed. They assume the executive understands the underlying technology. Avoid this. Assume the executive understands the business impact, not the engineering implementation.
If the system model changes, the viewpoint must update automatically. If you manually update the view to match the model, errors will occur. Use filtering rules that update dynamically with the model data.
Do not show a requirement without showing the element that satisfies it. Executives need to see the link between the “Why” and the “How”. Without this link, the model is just a picture.
Trying to answer every question in one view creates a cluttered mess. It is better to have three clear views than one confusing one. Separate Cost, Schedule, and Technical views if necessary.
Communication is two-way. Executives may identify new concerns during a review. Capture these concerns and adjust the viewpoint design accordingly. A static viewpoint becomes obsolete quickly.
How do you know if a viewpoint is working? Look for these indicators:
If the viewpoint leads to more questions than answers, the abstraction level is likely incorrect. Adjust the detail level until the balance is struck.
Models are not static documents. They are living representations of the system. As the system evolves, the viewpoint must evolve.
Consider the following for long-term maintenance:
By treating viewpoints as first-class artifacts, you ensure that the communication channel remains open and effective throughout the project life cycle.
To summarize, effective SysML viewpoint design for executives requires:
When these elements are combined, the model becomes a powerful tool for strategic alignment. It transforms complex engineering data into actionable business intelligence.