 Visual Paradigm Desktop |
  Visual Paradigm Online


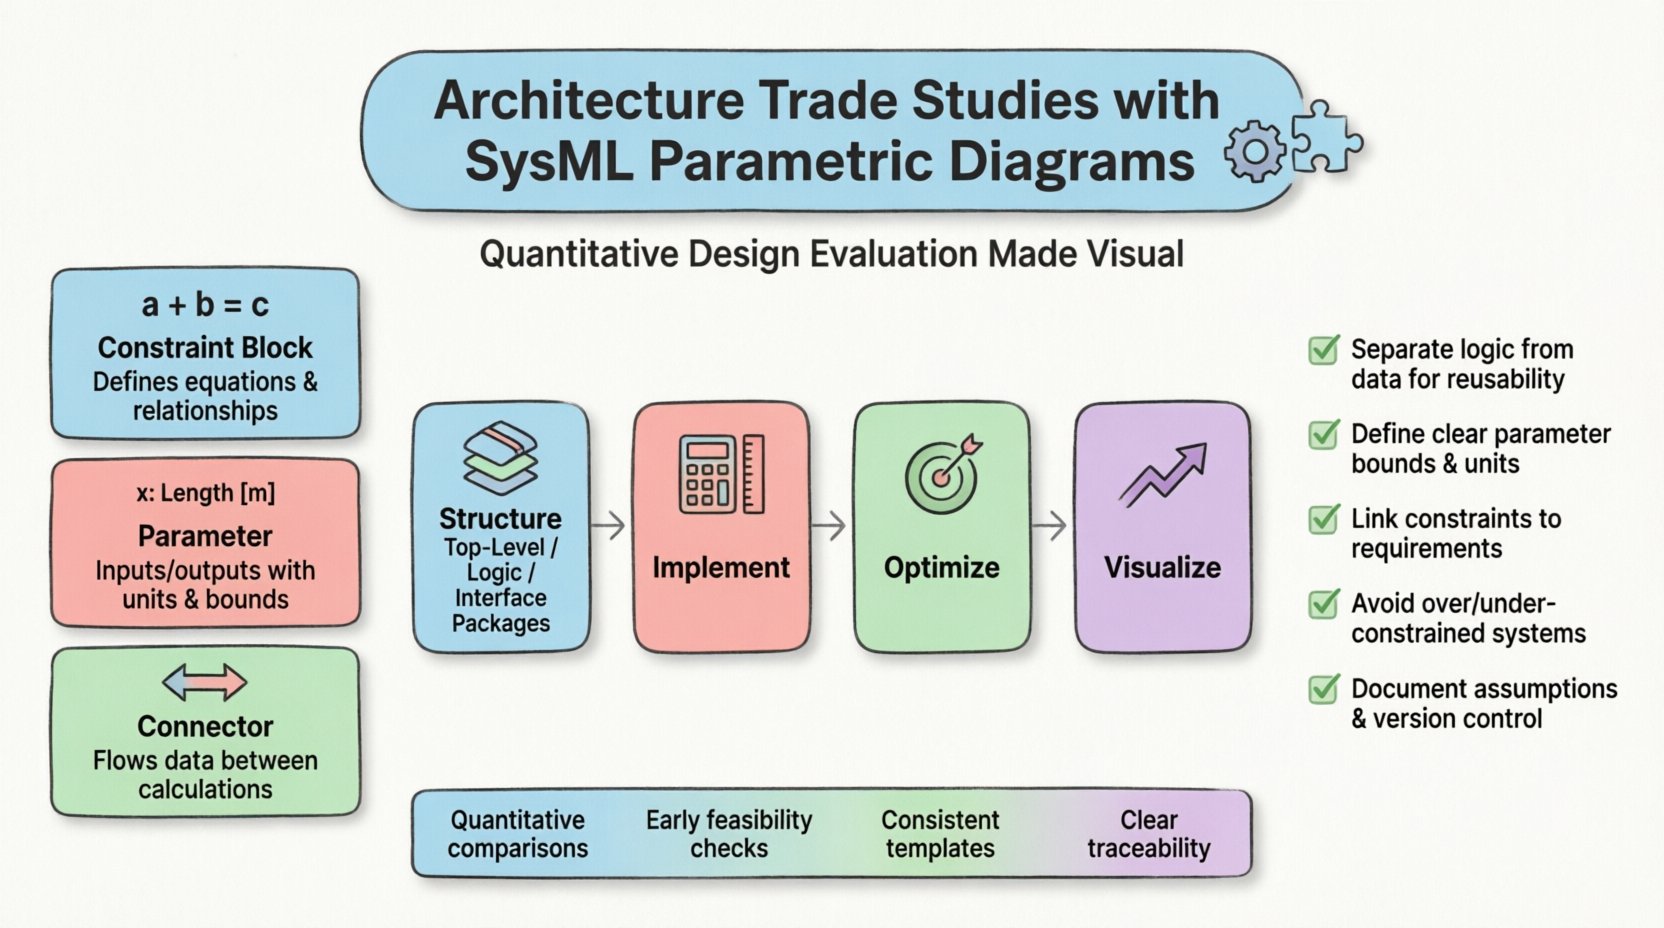
Model-Based Systems Engineering (MBSE) relies heavily on the ability to quantify system performance before physical implementation begins. SysML Parametric Diagrams serve as the mathematical backbone for this quantitative analysis. When constructing an Architecture Trade Study, the goal is to evaluate competing design alternatives against specific performance criteria. This guide details the structural and logical approach to building robust trade study templates using SysML standard modeling constructs. It focuses on the mechanics of constraint blocks, equations, and parameter relationships without referencing specific commercial tooling.
Parametric diagrams extend the structural capabilities of SysML by introducing mathematical relationships. In the context of a trade study, these diagrams translate abstract requirements into solvable equations. They allow engineers to define the boundaries of feasible design spaces. By modeling these constraints explicitly, teams can identify infeasible configurations early in the lifecycle.
Without a standardized template approach, trade studies can become fragmented. Different engineers might model the same trade criteria differently, leading to inconsistent results. A reusable template ensures that the underlying logic remains consistent across different projects or system phases.
Building a reliable trade study requires specific building blocks. These elements form the syntax of the parametric model. Understanding their function is essential before attempting to connect them into a larger architecture.
A constraint block defines a mathematical relationship. It is not a physical object but a logical definition. In a trade study, constraint blocks represent the physics, laws of motion, or operational limits that govern the system.
Parameters represent the specific data points being exchanged between constraint blocks. They carry units, data types, and default values. In a trade study, parameters are the variables that change during optimization.
Connectors establish the flow of information between parameters. They ensure that the output of one calculation becomes the input of another. Proper connection is critical for the solver to converge on a solution.
A trade study template is a skeleton that can be populated with specific values for different projects. It separates the logic from the data. This separation allows the same model structure to be used for different architectures while keeping the mathematical integrity intact.
To achieve this, organize the model using the following hierarchy:
| Component | Purpose | Example Usage |
|---|---|---|
| Constraint Block | Defines the math | Thrust Equation, Drag Calculation |
| Parameter | Holds the value | Mass (kg), Velocity (m/s) |
| Connector | Links values | Mass -> Drag Block |
| Requirement Link | Links to text | REQ-001: Max Speed |
This structure ensures that when a new trade study begins, the engineer only needs to update the values in the Top-Level Package, not the underlying logic.
The heart of the parametric diagram is the equation. These equations describe the trade space. They must be precise and dimensionally consistent. Ambiguity in equations leads to solver errors or incorrect results.
When writing equations within a constraint block, follow these principles:
Many system architectures involve non-linear relationships. A linear trade study might suggest a direct correlation between fuel and range. However, aerodynamic drag often scales with the square of velocity. The template must accommodate these complexities.
Parameters are the variables that the trade study will solve for. Managing them effectively prevents the model from becoming unmanageable as complexity grows.
Distinguishing between inputs and outputs is vital for the solver to know which direction to push the values.
| Type | Role in Trade Study | Example |
|---|---|---|
| Input Variable | Fixed or controlled values | Engine Thrust, Wing Area |
| Output Variable | Dependent results | Acceleration, Fuel Burn |
| Intermediate Variable | Calculated values within the model | Drag Force, Lift Coefficient |
Every parameter should have defined constraints. These act as guardrails for the trade study.
By setting these constraints, the model avoids returning solutions that are physically impossible or cost-prohibitive.
Once the model is built, the next step is running the analysis. This involves instructing the system to find values that satisfy the constraints while optimizing a specific objective.
This approach focuses on maximizing or minimizing one specific metric. For example, minimizing weight while maintaining structural integrity.
Real-world trade studies often involve conflicting goals. Increasing speed might decrease range. Multi-objective optimization finds a balance, often resulting in a Pareto frontier.
A model is useless if the results cannot be communicated. Parametric diagrams often generate large datasets that need to be summarized for stakeholders.
Visual representations help teams understand the trade-offs. Common chart types include:
Automated reporting extracts the final parameter values into a format suitable for decision-making.
Consistency in reporting is key. Using a standard template for reports ensures that every trade study is reviewed with the same level of detail.
Even with a well-structured template, errors can occur. Understanding common issues saves time during the modeling process.
This occurs when there are more equations than variables. The solver cannot find a solution because the system is mathematically impossible.
This happens when there are more variables than equations. The solver has infinite possibilities and cannot converge.
Using incompatible units (e.g., mixing meters and feet) leads to calculation errors.
A trade study does not exist in a vacuum. It must integrate with the broader system model. This integration ensures that the chosen architecture satisfies the stakeholder needs.
Every constraint block should trace back to a specific requirement. This creates a clear line of evidence for why a design decision was made.
The parametric diagram is the mathematical shadow of the structural diagram. Links should exist between the blocks in the structural view and the parameters in the parametric view.
Models are living documents. They evolve as the system design matures. Adhering to maintenance best practices keeps the trade study useful over time.
Building architecture trade study templates using SysML Parametric Diagrams is a rigorous process. It demands precision in mathematical modeling and discipline in model structure. By separating logic from data, defining clear constraints, and integrating with requirements, engineers can create a robust framework for decision-making. The effort invested in creating a solid template pays dividends in reduced analysis time and increased confidence in the final system design. These models serve as a permanent record of the trade-offs made, providing clarity for future engineering phases.
The use of standardized templates ensures that every trade study follows the same logical path. This consistency reduces the risk of oversight and facilitates collaboration between different engineering teams. As the complexity of systems increases, the reliance on parametric modeling will only grow. Mastering the structure of these diagrams is a fundamental skill for any systems engineer engaged in quantitative design.