 Visual Paradigm Desktop |
  Visual Paradigm Online


Software projects often stumble not because of code quality, but because of misunderstood requirements. When teams jump straight into design or development without a clear map of data movement, the result is technical debt and scope creep. This is where the Data Flow Diagram, or DFD, proves its worth. It serves as a visual language that bridges the gap between business stakeholders and technical architects.
A Data Flow Diagram is a graphical representation of the flow of data through an information system. Unlike flowcharts, which focus on control logic and decision points, DFDs focus on information flow. They show how data enters the system, how it is transformed, where it is stored, and how it leaves. In the context of requirements gathering, this distinction is vital. It shifts the conversation from what the system does to what data the system handles.
This guide explores the mechanics, benefits, and strategic application of DFDs. We will examine how they clarify ambiguity, support validation, and ensure that the final product aligns with business needs.
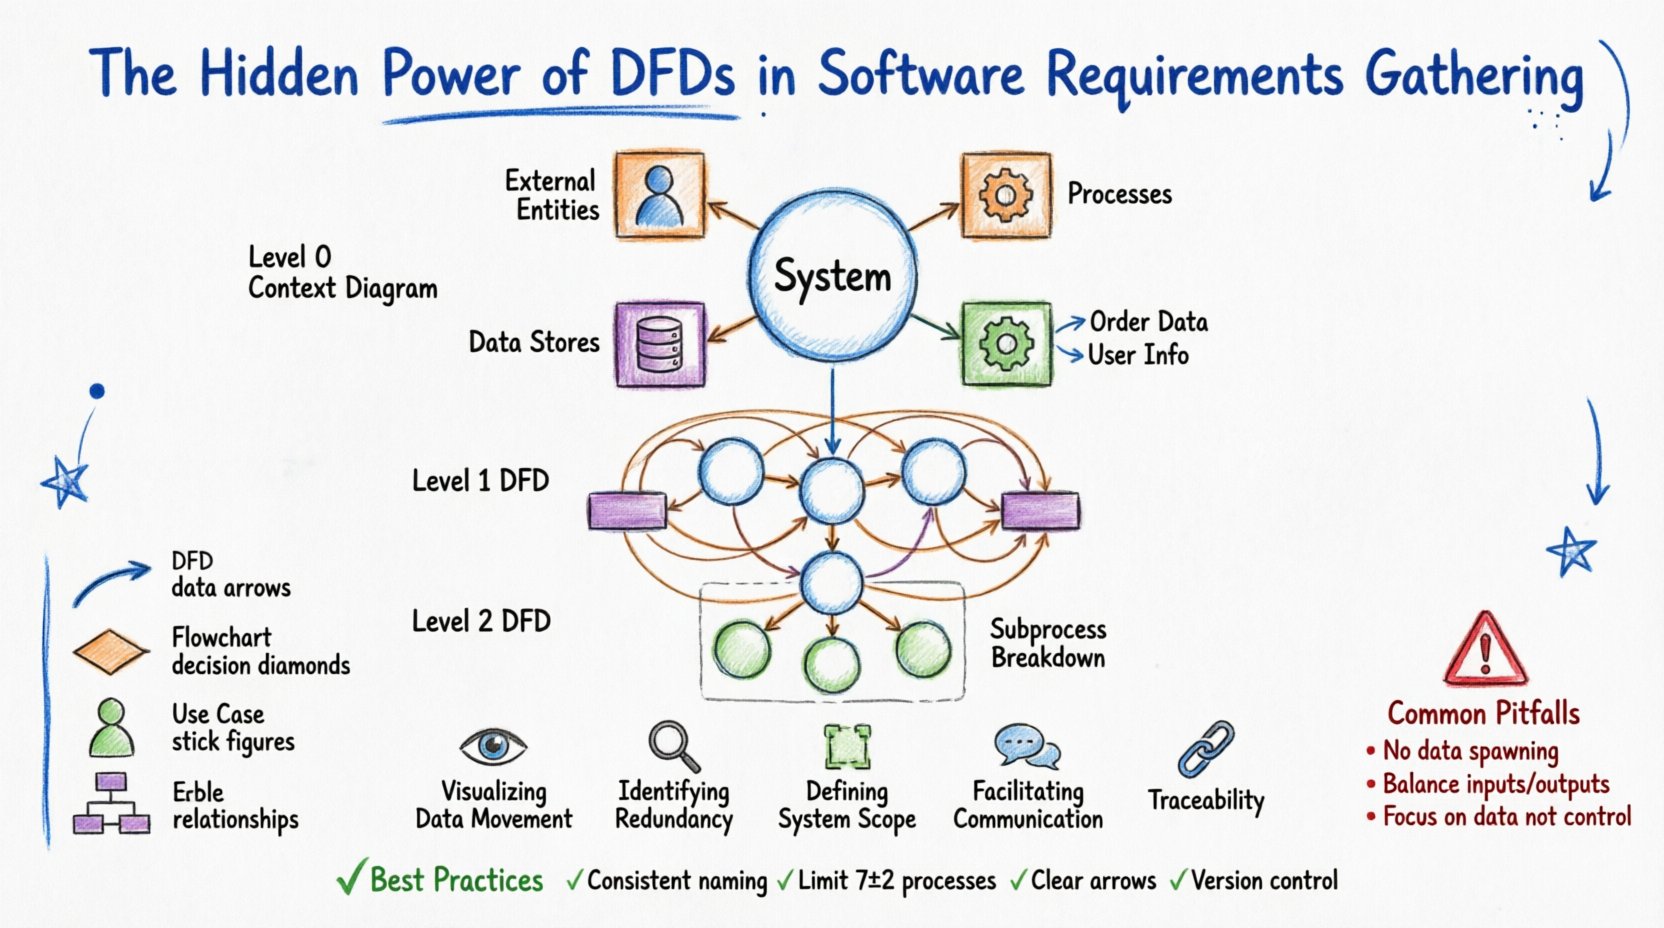
Before applying DFDs to complex projects, one must understand the building blocks. A DFD is composed of four fundamental elements. Each has a specific geometric representation and a strict definition regarding its function within the system.
Understanding these components prevents confusion during requirements workshops. Stakeholders often confuse a process with a data store. A clear diagram clarifies that a “Customer” is an entity, but “Customer Records” is a store. This distinction is the foundation of accurate system modeling.
Requirements documents often suffer from text-heavy descriptions that are open to interpretation. A DFD offers a single source of truth that is visual and spatial. Here is why they are indispensable during the analysis phase.
DFDs are not created in a single view. They are decomposed hierarchically to manage complexity. This approach allows analysts to start with a high-level overview and drill down into specific details without overwhelming the reader.
This is the highest level. It represents the entire system as a single process. It shows the system’s relationship with the external world. You will see the single process in the center, surrounded by all external entities connected by data flows. This diagram answers the question: “What is the system, and who does it interact with?”
Here, the single process from the context diagram is exploded into major sub-processes. This level typically contains 5 to 9 processes. It shows the major functional areas of the system. It includes data stores and external entities, but the focus is on the primary transformations.
Each process from Level 1 can be further decomposed into a Level 2 diagram. This is useful for complex logic. For example, the “Process Payment” process might be broken down into “Validate Card,” “Charge Account,” and “Update Ledger.” Decomposition stops when the processes are simple enough to be implemented as a single module or function.
Constructing an effective DFD requires discipline. It is not just about drawing lines; it is about capturing logic accurately. Follow this structured approach to ensure quality.
Even experienced analysts make mistakes. Recognizing these errors early saves significant time during the development phase. Below are the most frequent issues encountered when modeling requirements.
| Pitfall | Description | Correction |
|---|---|---|
| Data Spawning | Data appears out of nowhere without an input source. | Every arrow must originate from an entity, process, or store. |
| Data Destruction | Data flows into a process but disappears without output or storage. | Ensure every input results in a meaningful output or is saved. |
| Control Logic | Using DFDs to show decision logic (if/else) instead of data flow. | Use flowcharts for logic control; use DFDs for data movement. |
| Unbalanced Diagrams | Child diagrams have different inputs/outputs than the parent. | Review the decomposition to ensure all data flows are accounted for. |
| Ghost Processes | Processes that do not change the data or store it. | Remove processes that do not perform a transformation. |
| Direct Entity-to-Entity Flow | Data flows between two external entities without passing through the system. | This is outside the system scope. The system must process the interaction. |
It is common to confuse DFDs with other diagramming methods. Each tool serves a specific purpose in the software engineering lifecycle. Knowing when to use which diagram prevents confusion.
To ensure your diagrams remain useful artifacts throughout the project lifecycle, adhere to these standards. Consistency is key to maintaining the integrity of the requirements model.
One of the most powerful aspects of a well-constructed DFD is its ability to support traceability matrices. Traceability ensures that every requirement is met and nothing is built without purpose.
When you create a DFD, you can assign a unique ID to each process and data store. For example, Process P1.0 might correspond to Requirement REQ-001. If a stakeholder requests a new feature, you can map it to a specific process ID. If you can find the process in the diagram, you know exactly where the data logic needs to change.
This is particularly important during regression testing. If the “Calculate Interest” process is modified, the DFD tells the QA team exactly which data flows are affected. They know to test the input (Principal Amount) and the output (Interest Payment) specifically. Without the DFD, testers might miss edge cases related to data transformation.
Some teams argue that DFDs are too heavy for Agile methodologies. They prefer user stories and acceptance criteria. While user stories are excellent for functionality, they often lack the systemic view of data flow. DFDs fit well into Agile if used as a living artifact.
A DFD is often paired with a Data Dictionary. The Data Dictionary provides the technical definition of every data element shown in the diagram. It specifies data types, lengths, and formats.
For example, a data flow labeled “Date of Birth” on the diagram might be defined in the dictionary as “YYYY-MM-DD, ISO 8601, Nullable.” This precision prevents developers from guessing how to store the data. When requirements gathering includes both DFDs and a Data Dictionary, the risk of data type mismatches drops significantly.
Consider the following components for your Data Dictionary:
The journey from concept to code is fraught with misinterpretation. Data Flow Diagrams act as a stabilizing force in this journey. They force the team to confront the reality of data movement. They expose gaps in logic before a single line of code is written.
Investing time in creating high-quality DFDs pays dividends in reduced rework. When stakeholders validate the diagram, they are validating the logic of the system. This shared understanding reduces the friction between business and technology teams. It moves the conversation from opinion to fact.
Remember that a DFD is not a static deliverable. It evolves as requirements evolve. Treat it with the same rigor as the codebase. Keep it updated, keep it accessible, and use it to guide your development efforts. By mastering the art of data modeling, you ensure that the software you build is not just functional, but logically sound and aligned with the needs of the business.
The hidden power of DFDs lies in their simplicity. They strip away the noise of implementation details and focus on the core truth: data must flow correctly. When data flows correctly, the system works. When data is missing or misdirected, the system fails. Use this tool to guide your requirements gathering with confidence and precision.