 Visual Paradigm Desktop |
  Visual Paradigm Online


In a rapidly evolving global marketplace, organizations must look beyond immediate financial metrics to anticipate structural shifts. Understanding the macro-environmental forces that shape an industry is essential for long-term resilience. The PEST analysis model serves as a foundational framework for scanning the external environment. By systematically examining Political, Economic, Social, and Technological factors, leaders can identify early warning signs of industry disruption before they manifest as critical threats or opportunities.
This guide explores how to leverage PEST analysis for strategic foresight. It provides a structured approach to gathering intelligence, interpreting data, and translating insights into actionable strategy without relying on hype or generic advice.
Disruption is not merely a change in market share; it represents a fundamental alteration in the value proposition of an industry. It often renders existing business models obsolete. Consider the transition from physical media to streaming, or from brick-and-mortar retail to e-commerce. These shifts were not accidental; they were driven by external pressures that traditional planning often overlooked.
Forecasting disruption requires looking at the forces outside the organization’s direct control. Internal efficiency improvements cannot save a company if the underlying market structure collapses. External analysis provides the context necessary to understand why a market is changing.
PEST analysis offers a structured way to categorize these external pressures. It moves beyond intuition and forces a disciplined review of the macro-environment.
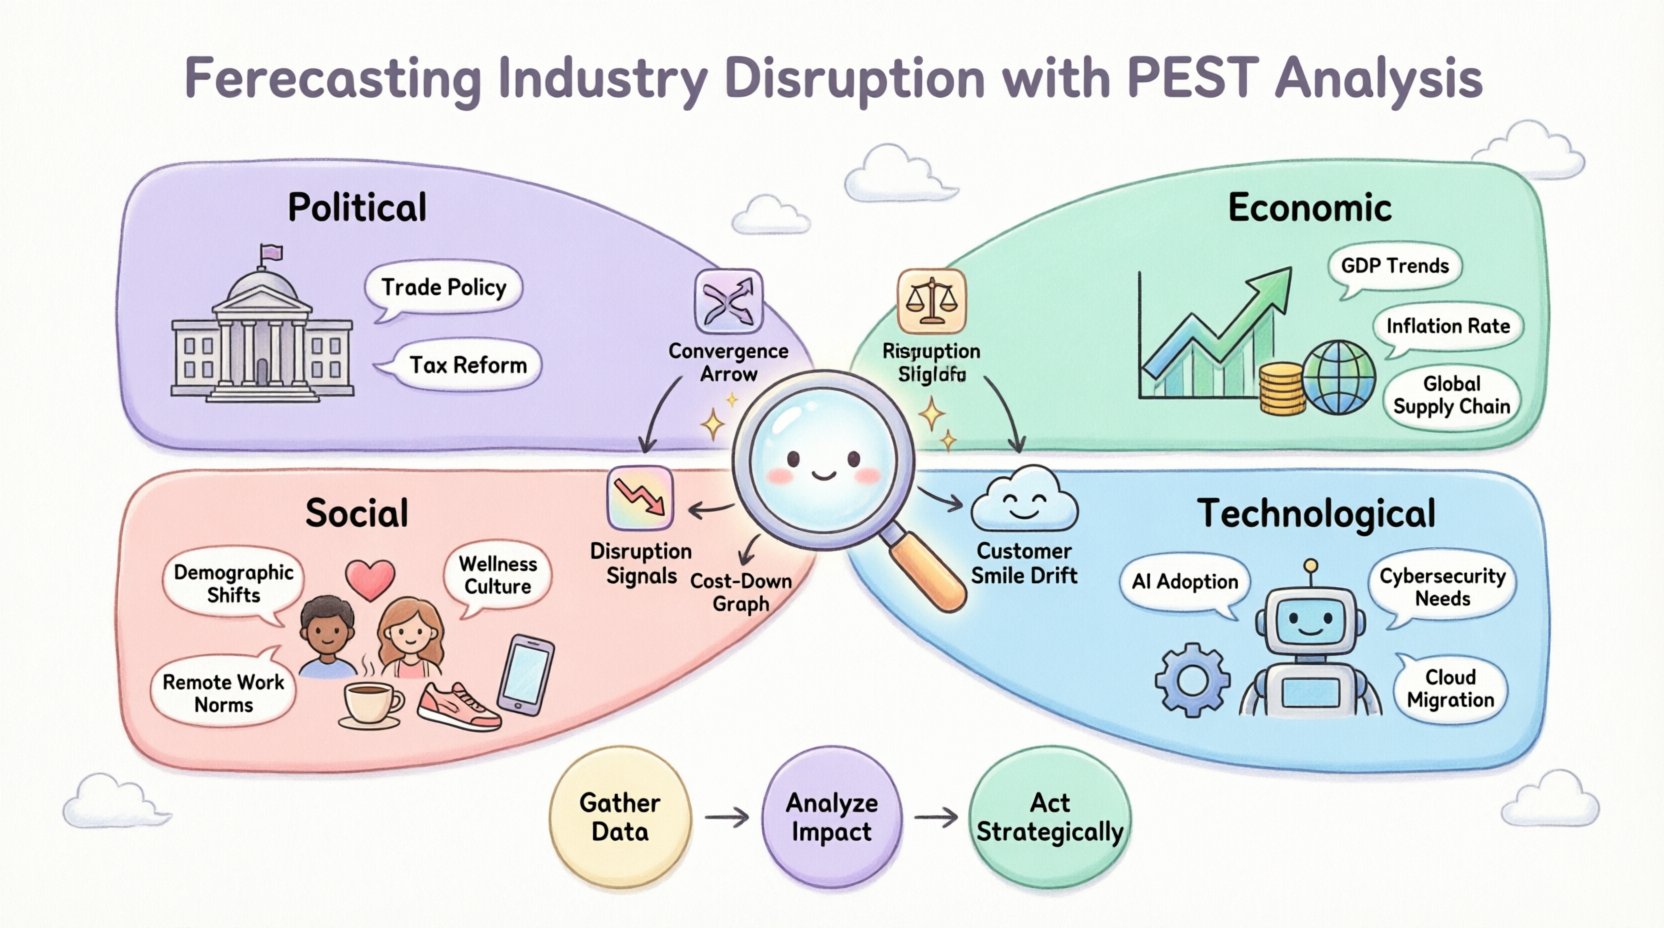
PEST stands for Political, Economic, Social, and Technological. Each category represents a distinct set of external factors that influence an organization. While often used for market entry, its true power lies in identifying long-term trends that signal disruption.
Political factors encompass the influence of government policy on business. This is not limited to domestic legislation but includes international relations and geopolitical stability. Changes here can create barriers to entry or open new markets.
When forecasting disruption, look for regulatory trends that are gaining momentum. A proposed law today may be a compliance requirement tomorrow, forcing the industry to adapt or exit.
Economic factors determine the purchasing power of potential customers and the cost of capital. These variables fluctuate frequently but also exhibit long-term cycles that define industry health.
Economic disruption often stems from shifts in liquidity or confidence. A recession might accelerate the adoption of cost-saving technologies, fundamentally changing the competitive landscape.
Social factors relate to the demographic and cultural aspects of the environment. Understanding the workforce and the consumer base is critical. These trends are often slower to change but more permanent than economic cycles.
Disruption often occurs when social values shift faster than corporate adaptation. Companies that ignore changing social norms risk losing relevance with their customer base.
Technological factors are frequently the most volatile and disruptive element of the PEST model. This includes innovations that create new markets or destroy existing ones.
Technological disruption is rarely linear. It often follows a curve where early adoption is slow, followed by rapid scaling that renders legacy systems obsolete.
Executing a PEST analysis requires discipline and access to reliable information. The process should be collaborative, involving stakeholders from various departments to ensure a holistic view.
Simply listing factors is not enough. The goal is to interpret the data for signs of disruption. Certain patterns indicate that the status quo is under threat.
When analyzing the results of your PEST analysis, look for the following indicators:
The table below outlines specific examples of how each PEST category can signal potential disruption within an industry.
| Category | Factor Example | Disruption Signal |
|---|---|---|
| Political | Carbon Emission Taxes | High-cost legacy energy sources become unviable; renewable adoption accelerates. |
| Economic | Global Supply Chain Costs | Manufacturing moves closer to consumption hubs; logistics models shift. |
| Social | Remote Work Acceptance | Office real estate demand drops; collaboration tools become essential infrastructure. |
| Technological | AI Automation Capabilities | Service jobs face obsolescence; data-driven decision-making becomes the norm. |
A PEST analysis should not exist in isolation. It gains value when integrated into broader strategic planning frameworks. Combining PEST with tools like SWOT analysis allows organizations to map external threats against internal weaknesses.
Strategy is about making choices. PEST provides the data to make informed choices about where to compete and where to retreat.
Even with a robust framework, errors can occur during the analysis process. Awareness of these common mistakes helps maintain the integrity of the findings.
While a deep-dive analysis might occur annually, the factors should be monitored continuously. High-volatility sectors like technology require quarterly reviews, whereas stable industries may manage with annual updates.
No model can predict the future with certainty. PEST analysis helps assess probabilities and prepare for multiple potential futures. It reduces uncertainty rather than eliminating it.
PESTLE includes Legal and Environmental factors as distinct categories. This is useful for industries with heavy regulatory burdens or sustainability concerns. The core logic remains the same.
Reliable sources include government census data, central bank reports, academic research, industry white papers, and reputable news organizations. Avoid anecdotal evidence.
Include representatives from strategy, finance, operations, and marketing. Diverse perspectives prevent blind spots and ensure a comprehensive view of the environment.
Forecasting industry disruption is not about guessing the next big thing. It is about building a system that detects changes in the environment early. The PEST analysis model provides the structure to do this systematically.
Leadership requires the courage to act on uncomfortable truths. If the analysis suggests that a core product line is threatened by technological shifts, the organization must pivot. If political trends indicate a shrinking market, the strategy must shift to new geographies.
By maintaining a rigorous approach to external analysis, organizations can navigate uncertainty with confidence. The goal is not to control the environment, but to understand it well enough to thrive within it.
Continuous learning and adaptation are the only sustainable competitive advantages. Use this framework to stay informed, stay relevant, and maintain momentum in a changing world.