 Visual Paradigm Desktop |
  Visual Paradigm Online


Diagramming is a fundamental skill in system analysis and software design. It translates abstract concepts into visual structures that teams can understand and critique. However, two methods often cause confusion among practitioners: the Data Flow Diagram (DFD) and the Flowchart. While both represent processes, they serve distinct purposes, utilize different symbols, and focus on different aspects of system behavior. Selecting the wrong tool can lead to miscommunication, flawed logic, or inefficient development cycles. This guide provides a clear, authoritative breakdown of both methodologies.
Understanding the nuances between these diagrams is essential for anyone involved in requirements gathering, system architecture, or process improvement. This document explores the technical specifications, practical applications, and critical differences to ensure accurate modeling.
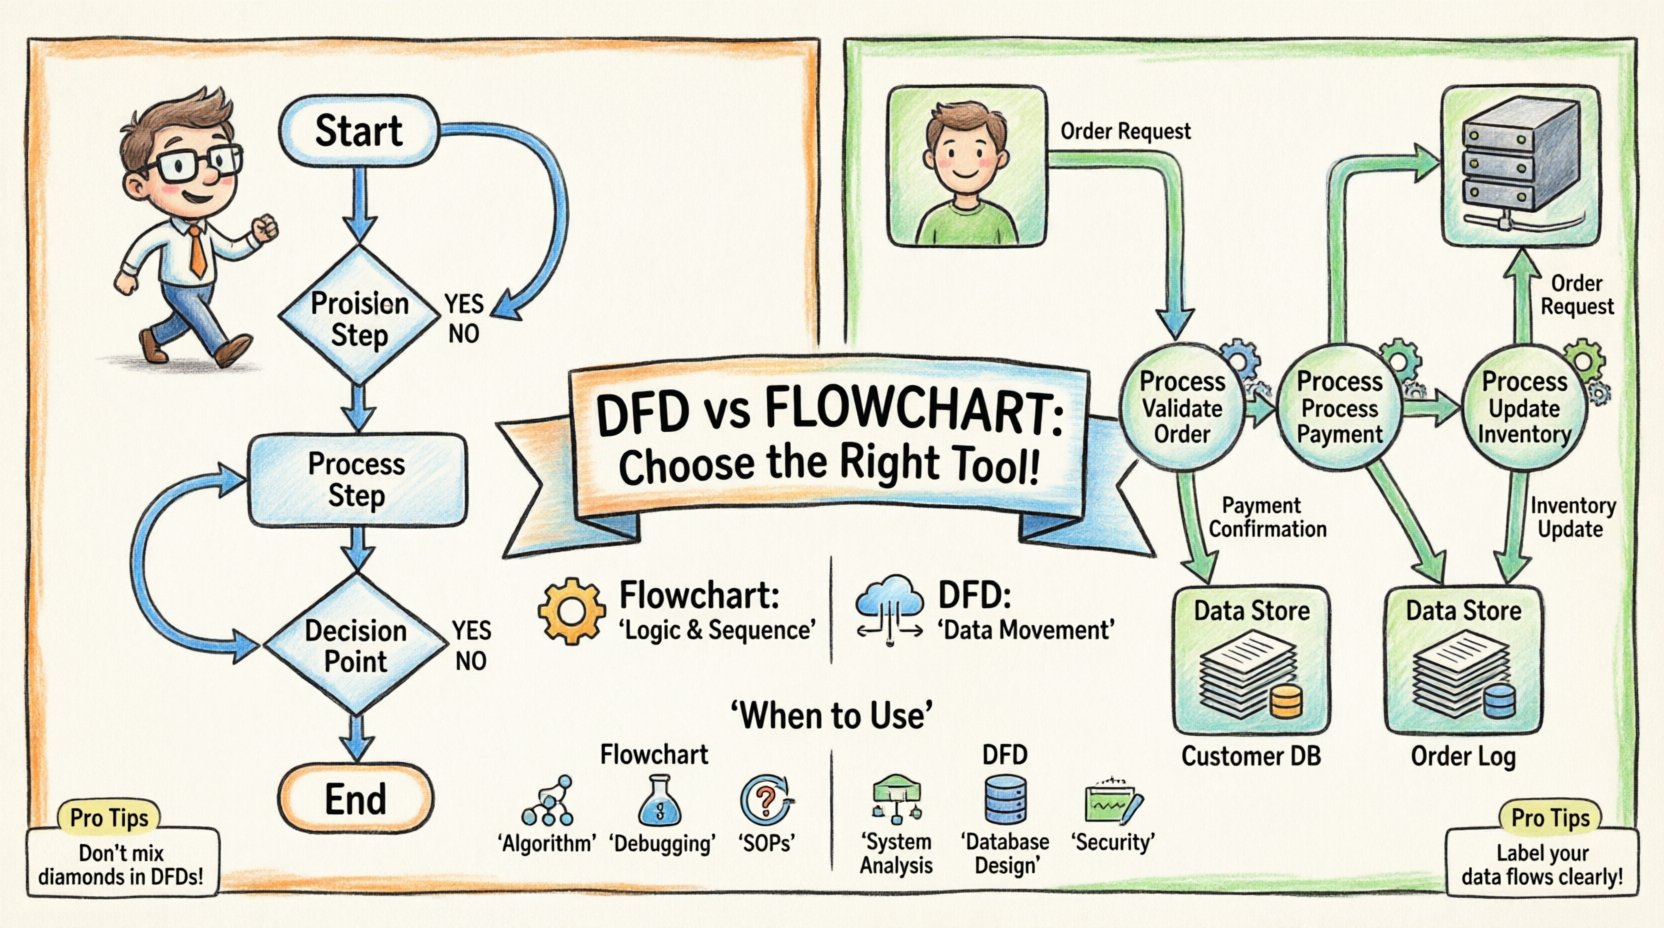
A flowchart is a graphical representation of an algorithm, workflow, or process. It maps out the sequence of steps taken to achieve a specific outcome. The primary focus of a flowchart is on control flow. It details the logic of how a process moves from start to finish, including decision points, loops, and conditional paths.
Flowcharts rely on a standardized set of shapes, often associated with ANSI or ISO standards. Each shape carries a specific meaning regarding the action being performed:
The flow of logic is indicated by arrows connecting these shapes. This visual hierarchy allows analysts to trace the execution path of a program or a business procedure. It is particularly useful for documenting how a system behaves under specific conditions.
Flowcharts are ideal when the complexity lies in the logic and decision-making within a process. Consider the following scenarios:
The strength of a flowchart is its ability to show branching paths. If a user enters invalid data, the flowchart clearly directs them to a correction step. If the data is valid, it moves to the processing stage. This focus on control logic is what separates it from data-centric models.
A Data Flow Diagram (DFD) is a structured analysis tool used to represent the flow of information within a system. Unlike a flowchart, a DFD does not show the order of operations or the timing of events. Instead, it focuses on data movement. It illustrates how data is transformed, stored, and transmitted between different parts of a system.
DFDs use a specific set of symbols defined by methodologies such as Yourdon/DeMarco or Gane & Sarson. The focus is on the data itself rather than the logic controlling it.
A critical rule in DFDs is that data cannot flow directly between two data stores without a process in between, nor can it flow directly from an external entity to a data store without a process. This ensures that all data storage involves some form of transformation or management.
DFDs are hierarchical. They are broken down into levels to manage complexity and provide detail as needed.
DFDs are best suited for defining the functional requirements of a system. They help stakeholders understand what data the system handles and how it moves. Use cases include:
The primary advantage of a DFD is its ability to abstract away the timing and logic, focusing purely on the information architecture. It answers the question: “Where does the data go?” rather than “How does the system decide what to do?”
While both diagrams use arrows and boxes, their underlying philosophy differs significantly. Confusing the two can result in a model that fails to capture the system’s true nature.
| Feature | Flowchart | DFD |
|---|---|---|
| Focus | Control Flow (Logic & Sequence) | Data Flow (Movement & Transformation) |
| Symbols | Ovals, Rectangles, Diamonds | Squares, Circles, Open Rectangles |
| Arrows | Indicate sequence of steps | Indicate direction of data |
| Time | Implies order and timing | Does not imply order or timing |
| Decision Points | Central (Diamonds) | None (Logic is hidden in processes) |
| Data Stores | Not explicitly shown | Explicitly shown (Repositories) |
| Best For | Program logic, workflows | System architecture, requirements |
The most significant distinction is the concept of control. A flowchart is a map of control. It tells you what happens next. If condition A is met, go to step B. If not, go to step C. This is crucial for programming and operational procedures.
A DFD is a map of data. It tells you what data is available and where it travels. It does not care if step B happens before step C. In a DFD, processes may run in parallel, sequentially, or asynchronously. The diagram simply shows that Process 1 produces Data X, and Process 2 consumes Data X.
Flowcharts typically do not include data storage. They focus on the action. If a flowchart mentions a file, it is usually a minor input/output step. In a DFD, data stores are first-class citizens. They represent the memory of the system. Identifying data stores early is critical for database design. A DFD forces the analyst to think about persistence, whereas a flowchart assumes a linear execution.
Creating diagrams is easy; creating accurate, useful diagrams is a discipline. Several common errors occur when switching between these methodologies or when drawing without a clear strategy.
A frequent error is placing decision diamonds inside a DFD. DFDs do not handle logic. If a process depends on a condition, the condition should be described in the text accompanying the process, not drawn as a diamond. This keeps the diagram focused on data.
In DFDs, every data store must have at least one input and one output flow (unless it is a dead data store, which is rare). If a database exists but no process writes to it or reads from it, the diagram is flawed. Similarly, in flowcharts, every decision diamond must have at least two outgoing paths.
Labels on arrows and shapes must be precise. “Data” is not a label. “Customer Order Details” is a label. “Process Data” is weak. “Validate and Store Order” is strong. Clear naming conventions prevent misinterpretation during development.
Trying to fit too much into a single diagram reduces readability. If a process box contains more than 5 to 7 sub-processes, it should be decomposed into a lower-level DFD. The goal is to manage complexity, not hide it.
To ensure your diagrams serve their purpose, adhere to the following guidelines. These practices apply regardless of the diagramming tool used.
Both flowcharts and DFDs are integral parts of the Software Development Life Cycle (SDLC), but they appear at different stages.
During the initial phase, DFDs are often the primary tool. They help define what the system must do in terms of information processing. They help identify what inputs are required and what outputs are expected. This aligns the technical team with business goals.
As the project moves to design, flowcharts become more relevant. The high-level requirements from the DFD are translated into specific logic flows. Developers use flowcharts (or pseudocode) to implement the algorithms that will process the data identified in the DFD.
Both diagrams serve as reference points during testing. Test cases can be derived from the paths in a flowchart. Data integrity checks can be derived from the flows in a DFD. When changes are requested, updating these diagrams ensures that the documentation remains accurate.
For enterprise-level systems, simple diagrams may not suffice. Advanced modeling techniques exist to bridge the gap between these two methods.
A variation of the flowchart, swimlane diagrams add a dimension for responsibility. They show who performs each step. This is useful when multiple departments interact. It combines the logic of a flowchart with the organizational context.
For systems where the state of an object is critical (like an order changing from “Paid” to “Shipped”), flowcharts can be too linear. State diagrams show the transitions between states triggered by events. This is distinct from DFDs, which focus on data movement, and flowcharts, which focus on procedural steps.
In practice, teams often use both. A DFD defines the system boundaries and data architecture. A flowchart defines the logic within a specific process. For example, a DFD shows that “Order Processing” is a process. A flowchart then details the internal logic of how that “Order Processing” validates the credit card and checks inventory.
Choosing between a DFD and a Flowchart is not about which is better. It is about which is appropriate for the specific question you are trying to answer. If you need to know how data moves, use a DFD. If you need to know how decisions are made, use a Flowchart.
Mastering both allows for comprehensive system modeling. It ensures that the architecture is sound (DFD) and the logic is executable (Flowchart). By adhering to the standards and avoiding common pitfalls, you can create documentation that stands the test of time and facilitates clear communication across technical and non-technical teams.
Remember that diagrams are living documents. They should evolve as the system evolves. Regular reviews and updates ensure that the visual representation remains a true reflection of the operational reality. Whether you are mapping a simple workflow or a complex enterprise architecture, clarity is the ultimate goal of any diagramming effort.
Start with the requirements. Define the scope. Select the tool that matches the need. And document with precision. This disciplined approach leads to better systems and fewer misunderstandings.