 Visual Paradigm Desktop |
  Visual Paradigm Online


Designing a complex software system requires a clear map of how data moves and where it lives. Without a structured approach, architectures can become brittle, difficult to maintain, and prone to logical errors. Two of the most foundational modeling techniques in systems engineering are the Data Flow Diagram (DFD) and the Entity Relationship Diagram (ERD). While both serve the critical function of visualization, they address fundamentally different aspects of the system.
Understanding the distinction between these two models is not merely an academic exercise; it is a practical necessity for system architects, business analysts, and developers. Using the wrong model for the wrong phase of development can lead to miscommunication, database inefficiencies, or broken business logic. This guide explores the nuances of each diagram type, their specific components, and the strategic scenarios where one takes precedence over the other.
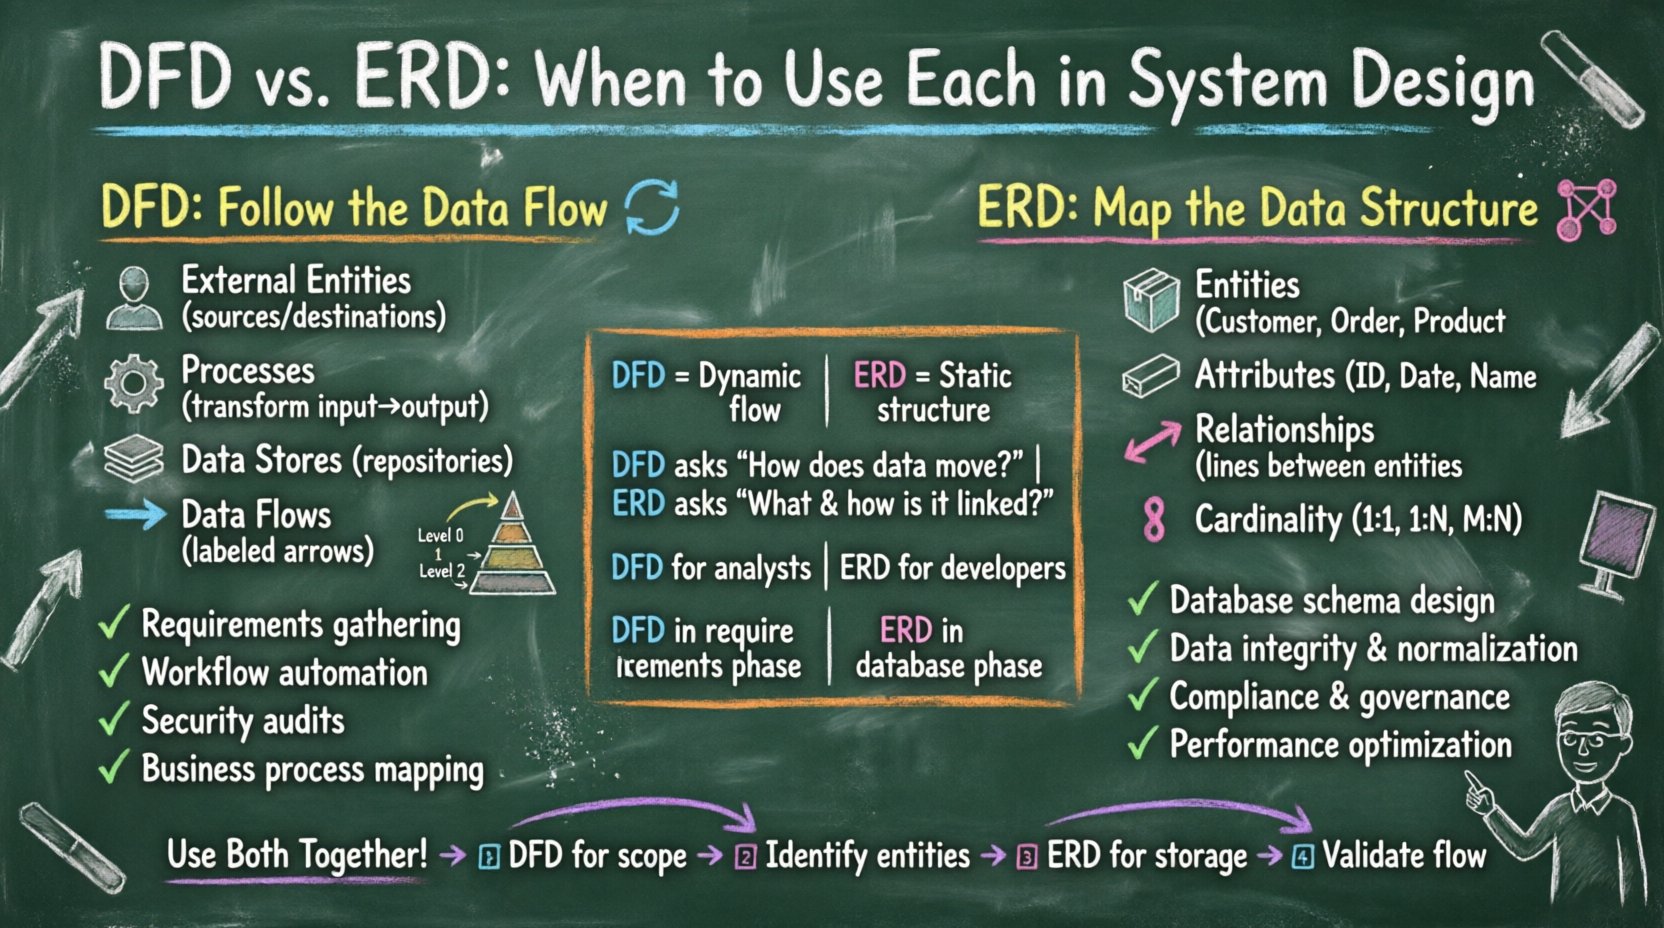
The Data Flow Diagram focuses on the movement of data through a system. It visualizes how information is processed, transformed, and stored. The DFD does not concern itself with the physical implementation details or the timing of processes. Instead, it provides a high-level view of the logical flow of information.
DFDs are typically created in a hierarchical manner to manage complexity:
DFDs are most effective during the requirements gathering and functional design phases. They help stakeholders visualize the system’s behavior without getting distracted by technical constraints. They are particularly useful for:
While the DFD tracks movement, the Entity Relationship Diagram focuses on structure. An ERD is a conceptual model used to define the data requirements and relationships within a database. It describes the static nature of the data, ensuring integrity and normalization.
ERDs are often the starting point for normalization. Normalization is the process of organizing data to reduce redundancy and improve integrity. An ERD helps visualize the logical schema before physical tables are created. It ensures that:
ERDs are essential during the database design phase. They bridge the gap between business requirements and technical implementation. They are best used when:
Comparing these two models side-by-side highlights their distinct purposes. While they may appear similar in their visual complexity, their intent diverges significantly.
| Feature | Data Flow Diagram (DFD) | Entity Relationship Diagram (ERD) |
|---|---|---|
| Primary Focus | Process and Data Movement | Data Structure and Relationships |
| Time Dimension | Dynamic (shows flow over time) | Static (shows structure at a point) |
| Key Question | How does data move? | What data is stored and how is it linked? |
| Target Audience | Business Analysts, Stakeholders | Database Administrators, Backend Developers |
| Lifecycle Phase | Requirements, Functional Design | Database Design, Implementation |
| Logic vs. Storage | Focuses on Logic | Focuses on Storage |
| Complexity | Can be complex due to many flows | Can be complex due to relationships |
There are specific scenarios where the DFD becomes the primary tool for system design. Choosing the DFD first is often the correct path when the business logic is the most complex part of the system.
In these cases, focusing on the ERD too early might obscure the logic of the system. A database can be designed perfectly, but if the process flow is flawed, the application will fail to meet user needs.
Conversely, there are situations where the integrity and structure of the data are the critical success factors. The ERD takes precedence when the data volume, relationships, and constraints are the driving forces.
Skipping the ERD in these scenarios can lead to a “spaghetti database” where tables are redundant, relationships are ambiguous, and performance degrades over time.
While it is useful to distinguish between DFD and ERD, the most successful systems often utilize both. They are complementary, not mutually exclusive. A robust system design process typically moves from the flow to the structure.
In a DFD, a data store is a generic placeholder. In an ERD, that same data store becomes a detailed table definition. The mapping process involves:
For example, if a DFD shows a “Customer” sending multiple “Orders,” the ERD must reflect a One-to-Many relationship between Customer and Order entities. If the DFD implies a complex many-to-many relationship (e.g., “Students” and “Courses”), the ERD must introduce an associative entity to resolve it.
Mixing these models or misusing them can lead to significant technical debt. Here are common errors to watch out for.
Do not include processing logic within an ERD. An ERD should define structure, not behavior. If you find yourself drawing arrows that represent “processing” in an ERD, you are likely describing a DFD instead.
A DFD should not be a flowchart of code. It should not detail every conditional branch or error handling routine. Keep the DFD at a logical level. If you detail every “if-else” statement, the diagram becomes unreadable and loses its high-level overview value.
Drawing lines between entities without defining cardinality is a common mistake. A line alone does not tell you if one customer can have zero orders or one million. Always specify 1:1, 1:N, or M:N to prevent ambiguity.
Both diagrams suffer when data attributes are vague. In a DFD, flows should be named descriptively (e.g., “Validated Payment Info” rather than “Data”). In an ERD, attributes should define data types and constraints where possible.
In a DFD, a process cannot exist without data flowing into or out of it. Ensure every process box has at least one incoming and one outgoing flow. Orphan processes indicate dead logic or missing data requirements.
To maintain clarity and utility, adhere to these documentation standards.
Selecting between a Data Flow Diagram and an Entity Relationship Diagram is not about choosing one over the other. It is about choosing the right tool for the specific phase of the design lifecycle. The DFD illuminates the path data takes, ensuring the system behaves as intended. The ERD anchors that data, ensuring it is stored reliably and efficiently.
By mastering the distinct purposes of these two models, architects can build systems that are both logically sound and structurally robust. The goal is not to produce a perfect diagram, but to produce a clear understanding of the system. When the team can look at a DFD and see the process, and look at an ERD and see the data, the foundation for a successful project is laid.
Remember that these models are communication tools. Their value lies in the shared understanding they create among the team members. Whether you are mapping a complex transaction or defining a user profile, keep the focus on clarity, accuracy, and alignment with business goals. With the right combination of flow and structure, system design becomes a disciplined art form rather than a guessing game.