 Visual Paradigm Desktop |
  Visual Paradigm Online


Agile development is often associated with speed, flexibility, and minimal documentation. Data Flow Diagrams (DFDs), conversely, are a classic system modeling technique that historically thrived in structured, plan-driven environments. At first glance, these two approaches might seem contradictory. However, when implemented correctly, DFDs serve as a critical bridge between abstract requirements and concrete system architecture within an Agile framework. This guide explores how visualizing data movement supports iterative development without sacrificing clarity or control.
Understanding where a piece of information originates, how it transforms, and where it settles is vital for building robust software. Whether you are designing a microservice architecture or refactoring a monolithic application, the principles of data flow remain constant. We will examine practical applications, integration strategies, and the specific value DFDs bring to a sprint cycle.
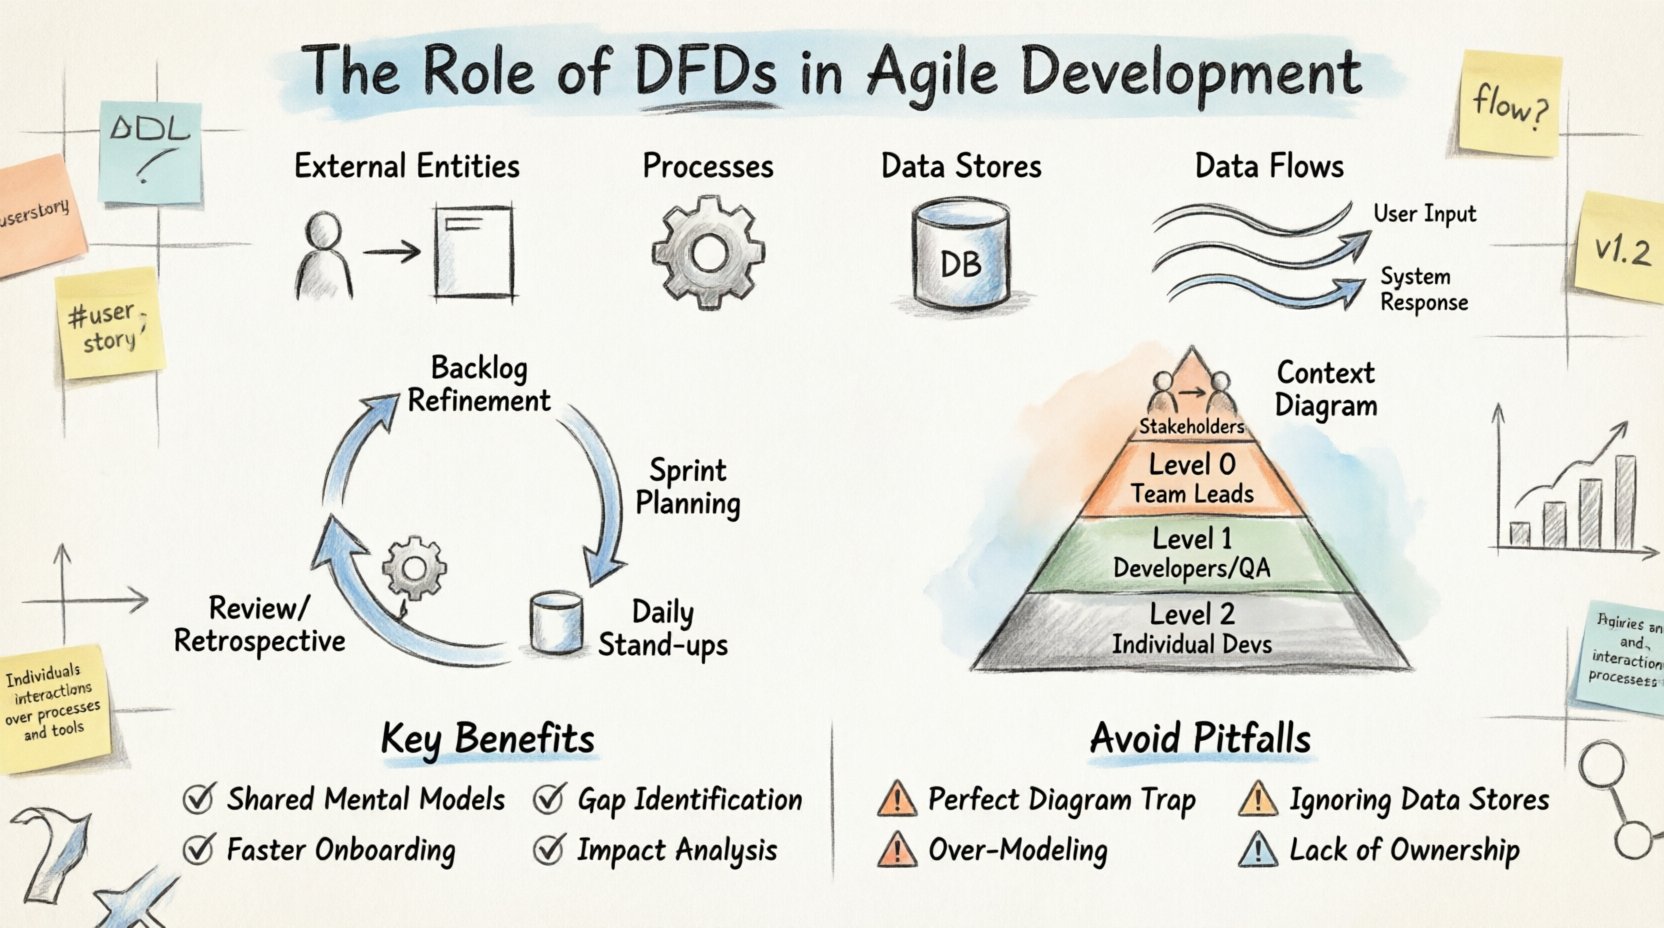
A Data Flow Diagram is a graphical representation of the flow of data through an information system. Unlike a flowchart, which depicts control logic and decision points, a DFD focuses on data. It maps out the movement of data from an external source, through processes, into data stores, and eventually to an external destination.
In an Agile setting, these diagrams are not static blueprints. They are living artifacts that evolve alongside the product. The core components of a DFD include:
When developers and product owners look at a DFD, they see the “what” of the system rather than the “how.” This distinction is crucial. It allows the team to validate that all necessary data is accounted for before writing a single line of code.
One common hesitation among Agile teams is the perceived overhead of creating diagrams. The Agile Manifesto values working software over comprehensive documentation. However, this does not mean documentation is worthless. It means documentation should be useful and not create unnecessary barriers.
DFDs can become a bottleneck if treated as a gatekeeping mechanism. Instead, they should be treated as a communication tool. Here are the key arguments for keeping DFDs in an Agile workflow:
The goal is not to create perfect diagrams that take weeks to draw. The goal is to create sufficient clarity to reduce rework. A quick sketch on a whiteboard that is refined later is often more valuable than a polished document that is never updated.
Integrating system modeling into an Agile sprint requires discipline. The diagrams must be created at the right time and with the right level of detail. Below is a breakdown of how DFDs fit into standard Agile ceremonies.
During refinement, the team breaks down epics into stories. This is the ideal moment to draft a high-level DFD. It helps the team understand the scope of the epic regarding data movement. If an epic involves moving customer data from a legacy system to a new dashboard, the DFD highlights the transformation steps required.
Once the sprint backlog is set, the team can drill down. For complex stories, a Level 1 or Level 2 DFD might be created. This ensures that the developers assigned to the story understand the data dependencies. It prevents a scenario where a developer builds an endpoint that expects data in a format the downstream process cannot handle.
While not every day requires diagramming, blockers often relate to data integrity. If a developer is stuck because a data store is missing an index or a flow is blocked by permission issues, referencing the DFD helps clarify the expected state versus the actual state.
After a sprint, the team should review if the DFDs still match the implemented code. If the architecture has drifted, the diagram should be updated. This practice keeps the documentation relevant and trustworthy for future sprints.
Not every feature requires a deep dive into every data transaction. Different levels of DFDs serve different purposes within the development lifecycle. Using the correct level prevents both under-specification and over-engineering.
| Level | Focus | When to Use | Typical Audience |
|---|---|---|---|
| Context Diagram | System boundary and external interactions. | Project initiation or high-level planning. | Stakeholders, Architects |
| Level 0 (High Level) | Major processes within the system. | System design phase or major feature planning. | Team Leads, Senior Devs |
| Level 1 (Mid Level) | Breakdown of major processes. | Sprint planning for complex features. | Developers, QA |
| Level 2 (Detailed) | Specific data transformations. | Coding phase for complex logic or integration points. | Individual Developers |
It is common for Agile teams to start with a Context Diagram and only drill down to Level 1 or 2 when a specific feature demands it. This just-in-time modeling approach ensures effort is not wasted on details that might change in the next iteration.
One of the most practical applications of DFDs in Agile is mapping them directly to User Stories. User Stories describe functionality from a user perspective (e.g., “As a user, I want to update my profile”). DFDs describe the data mechanics behind that functionality.
Consider a story about “Processing a Payment.” A User Story focuses on the success state. A DFD focuses on the journey of the money data. By combining them, the team ensures the functional requirement is supported by the technical reality.
Here is how the mapping works:
This mapping helps in creating acceptance criteria. If the DFD shows a flow to a “Transaction Log” store, the acceptance criteria must include verification that the log entry was created successfully. This creates a traceability link between the diagram and the test cases.
Modern applications often deal with complex data structures, nested objects, and asynchronous processing. Traditional DFDs can struggle to visualize asynchronous queues or event-driven architectures without modification. In an Agile context, it is important to adapt the notation to fit the reality of the system.
For event-driven systems, data flows can be viewed as events triggering processes. When using queues, the data store represents the message broker. When using APIs, the data flow represents the request/response cycle. The core principle remains the same: trace the information.
When dealing with microservices, a DFD can be expanded to show cross-service communication. This is vital for understanding latency and failure points. If Service A sends data to Service B, the DFD makes that dependency explicit. In a monolith, this dependency might be invisible until it causes a performance issue.
DFDs excel at facilitating conversation. They are language-agnostic enough that business analysts and developers can discuss the same artifact without confusion. However, this requires the diagram to be accessible and readable.
Best practices for collaborative diagramming include:
When a diagram is stored in the repository, it becomes part of the continuous integration pipeline. Automated checks can verify that the diagram matches the deployed configuration in certain contexts, though this is advanced usage.
Even with the best intentions, teams can misapply DFDs. Recognizing these pitfalls early saves time and effort.
Teams sometimes spend too much time making the diagram look pretty. In Agile, a rough sketch is better than a perfect document. Focus on clarity, not aesthetics. If a developer can understand the flow from a scribble, that is sufficient.
It is easy to focus on processes and forget where data lives. If a process writes to a store that no other process reads, it is dead weight. If a process reads from a store that is never updated, the data is stale. Regular reviews of data stores ensure the diagram remains accurate.
Not every variable needs a line on the diagram. Focus on the high-value data flows. If a system has a setting that changes rarely, it might not need a detailed flow line. Over-modeling creates noise and makes the diagram hard to maintain.
Who is responsible for updating the DFD when the code changes? If no one owns it, it becomes outdated quickly. Assign ownership of the diagram to the team lead or the architect for that specific domain.
How do you know if using DFDs is actually helping the Agile team? Look for these indicators over time:
If these metrics improve, the investment in modeling is justified. If they do not, the team should re-evaluate the granularity of the diagrams or the frequency of updates.
In many industries, data handling is regulated. Financial data, health records, and personal information have strict requirements regarding storage and movement. DFDs are particularly useful here for compliance audits.
A DFD clearly shows where sensitive data enters the system, how it is encrypted, where it is stored, and where it leaves. This visibility is essential for:
During an Agile sprint that involves sensitive data, the DFD should be reviewed by the security team before the code is merged. This integrates security into the development lifecycle without slowing it down.
Many Agile teams work on modernizing legacy systems. This often involves wrapping old functionality with new APIs or migrating data to new platforms. DFDs are invaluable in this context because they document the “black box” of legacy code.
By creating a DFD of the legacy system, the team can identify the entry and exit points for data migration. This helps in designing the bridge between the old and new systems. It ensures that no data is lost during the transition and that the new system handles the data correctly.
The integration of Data Flow Diagrams into Agile development is not about returning to heavy documentation. It is about maintaining a clear understanding of the system’s architecture while embracing iterative change. When used as a living, evolving tool rather than a static requirement, DFDs enhance communication, reduce risk, and improve the quality of the software delivered.
Teams that adopt this practice find that their technical debt related to data management decreases. They spend less time debugging data issues and more time building features. The key is balance. Create diagrams when they add value. Update them when the system changes. And always keep the end goal in mind: a system that works correctly and efficiently.