 Visual Paradigm Desktop |
  Visual Paradigm Online


In the complex landscape of system analysis, clarity is paramount. Business analysts often face the challenge of translating vague requirements into concrete technical specifications. One of the most effective tools for bridging this gap is the Data Flow Diagram, or DFD. This visual representation does more than just map data; it exposes the logical flow of information within a system. By utilizing DFDs, analysts can identify inconsistencies, missing inputs, and redundant processes that might otherwise go unnoticed until implementation. This guide explores the practical application of DFDs in uncovering process gaps and ensuring robust system design.
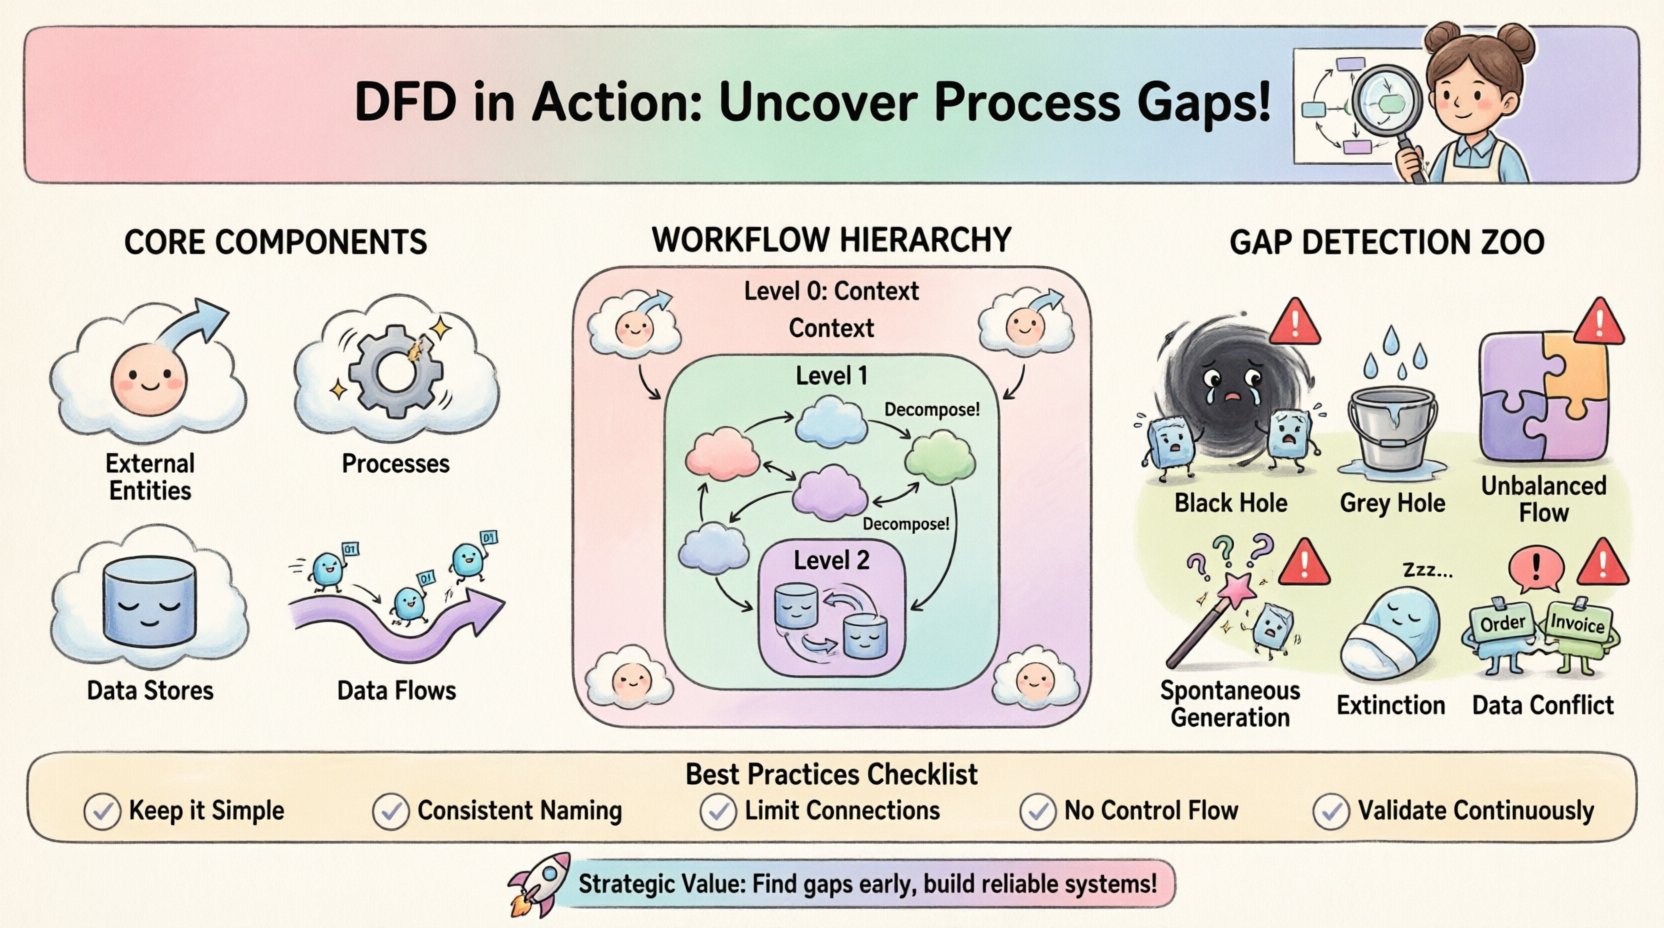
To utilize this tool effectively, one must understand its fundamental building blocks. A DFD is a structured diagram that illustrates how data moves through a system. It is not a flowchart, as it does not show decision points or control logic, but rather the transformation and storage of data. The following elements form the basis of every diagram:
When constructing a diagram, consistency is key. The same data flow name should appear identically across the diagram. This ensures that stakeholders understand exactly what information is being moved at every stage. Without this clarity, misinterpretations occur, leading to development errors.
Business analysts do not create diagrams in isolation. The process involves several stages of discovery and verification. The workflow typically follows a structured approach to ensure accuracy and completeness.
Before drawing lines and boxes, the analyst must understand the scope. This begins with high-level interviews and document reviews. The goal is to define the system boundaries. What is inside the system, and what is outside? This step often results in a Context Diagram, also known as a Level 0 DFD. It shows the system as a single process and its interactions with external entities.
Once the context is set, the single process is broken down into sub-processes. This is known as decomposition. A Level 1 DFD expands on the context diagram, showing the major internal processes. Each subsequent level, such as Level 2, drills down further into specific operations. This hierarchical approach allows for manageable complexity.
Draft diagrams must be reviewed with the people who perform the tasks daily. Business users can spot logical errors that technical analysts might miss. For instance, a user might point out that a specific report is never actually generated in the current workflow, revealing a gap between the proposed design and reality.
The primary value of a DFD lies in its ability to reveal gaps. A gap occurs when the logical flow of information is broken, incomplete, or inconsistent. Analysts look for specific anomalies that indicate these issues.
By systematically checking for these anomalies, analysts can refine the requirements before a single line of code is written. This proactive approach saves significant time and budget during the development phase.
Understanding the theoretical anomalies is useful, but seeing how they affect real operations is crucial. The table below outlines common DFD errors and the resulting operational issues.
| Anomaly Type | Description | Real-World Impact |
|---|---|---|
| Black Hole | Process has input, no output | Customer orders are received but never processed or confirmed. |
| Grey Hole | Process has partial outputs | Inventory is updated, but shipping labels are not generated. |
| Unbalanced Flow | Parent/Child data mismatch | System reports show different totals than the underlying database. |
| Spontaneous Generation | Output with no input | System generates error logs without any triggering event. |
| Extinction | Input to store, no read | Historical data is saved but never retrieved for reporting. |
| Circular Flow | Data flows loop endlessly | System hangs or enters an infinite processing loop. |
DFDs are hierarchical. Moving from high-level abstraction to granular detail is essential for managing complexity. Each level serves a specific purpose in the analysis process.
This is the highest level view. It defines the system boundary clearly. It shows the system as one bubble and all external entities surrounding it. It answers the question: “What is the system, and who talks to it?” It does not show internal processes.
This diagram breaks the single process of the context diagram into major sub-processes. It typically contains between 5 and 9 processes to maintain readability. It shows how data flows between these major functions. This level is often used for high-level planning and architectural decisions.
These diagrams detail specific sub-processes from Level 1. They show the specific data stores and the precise flows required to execute the task. While useful for developers, these should not be overly complex. If a Level 2 diagram becomes too crowded, it may need further decomposition into Level 3, though this is less common for business requirements.
One of the most common pitfalls in DFD creation is maintaining consistency across levels. When a process is decomposed, the data entering and leaving the parent process must match the data entering and leaving the child processes. This is known as balancing.
Analysts must verify that:
If a Level 1 process has an input called “Customer Order,” the Level 2 processes breaking it down must also use “Customer Order” or a clearly defined subset of it. Changing names without a reason creates confusion and breaks the traceability of requirements.
Diagrams are communication tools. Their value is lost if stakeholders cannot understand them. Business analysts must tailor the presentation of the DFD to the audience.
Regular workshops are effective for reviewing these diagrams. Walking through a specific scenario, such as “Processing a Return,” helps identify gaps in logic. If the diagram shows a step that the user says they never do, that is a gap to be addressed.
A DFD is not a one-time deliverable. Systems evolve, and requirements change. Keeping the diagrams up to date is crucial for future maintenance and enhancements. When a change occurs, the DFD should be updated to reflect the new reality. This ensures that the documentation remains a reliable source of truth.
Regular reviews should be scheduled, perhaps during each release cycle. This practice prevents documentation drift, where the diagrams no longer match the actual system. It also helps new team members understand the system architecture quickly.
DFDs should not exist in a vacuum. They work best when integrated with other analysis artifacts. A process description can accompany each bubble in the diagram, detailing the logic used. A data dictionary should define the data elements flowing through the lines. Use cases can be mapped to the processes to ensure functional requirements are met.
For example, if a use case describes “Login to System,” the DFD should show the flow of credentials to the authentication process and the return of a session token. This alignment ensures that functional and structural requirements are consistent.
To maximize the utility of DFDs, analysts should adhere to specific modeling standards.
By following these practices, the resulting diagrams become powerful tools for analysis rather than confusing obstacles. They provide a shared language for the team to discuss the system.
The strategic benefit of using DFDs extends beyond error detection. It facilitates a deeper understanding of the business domain. When an analyst draws a diagram, they are forced to think through the implications of every data movement. This mental exercise often reveals dependencies that were previously hidden.
Furthermore, DFDs help in identifying opportunities for automation. If a data flow involves manual handoffs between entities, that is a candidate for automation. If a data store requires constant manual entry, it may be a source of error. The visual nature of the diagram makes these opportunities obvious.
Ultimately, the goal is to build systems that work reliably. A well-crafted DFD is the blueprint for that reliability. It ensures that data is captured, processed, stored, and delivered exactly as intended. By mastering the creation and analysis of these diagrams, business analysts can drive significant improvements in system quality and operational efficiency.