 Visual Paradigm Desktop |
  Visual Paradigm Online


Data Flow Diagrams (DFD) serve as a foundational tool in system analysis and design. They provide a visual representation of how information moves through a system, highlighting inputs, outputs, storage, and processes. For beginners, understanding the mechanics of a DFD is crucial before attempting to map complex workflows. This guide explores the core principles, components, and rules required to construct accurate diagrams without relying on specific software tools.
A Data Flow Diagram is a structured analysis technique used to visualize the flow of data within a system. Unlike a flowchart, which focuses on the control logic and decision points, a DFD focuses strictly on the movement of data. It answers the question: Where does the data come from, where does it go, and what happens to it?
The primary objectives of using a DFD include:
When you begin analyzing a system, the goal is to create a model that stakeholders can understand. A well-constructed diagram eliminates ambiguity regarding data handling. It acts as a blueprint for developers and analysts alike, ensuring everyone agrees on how information travels.
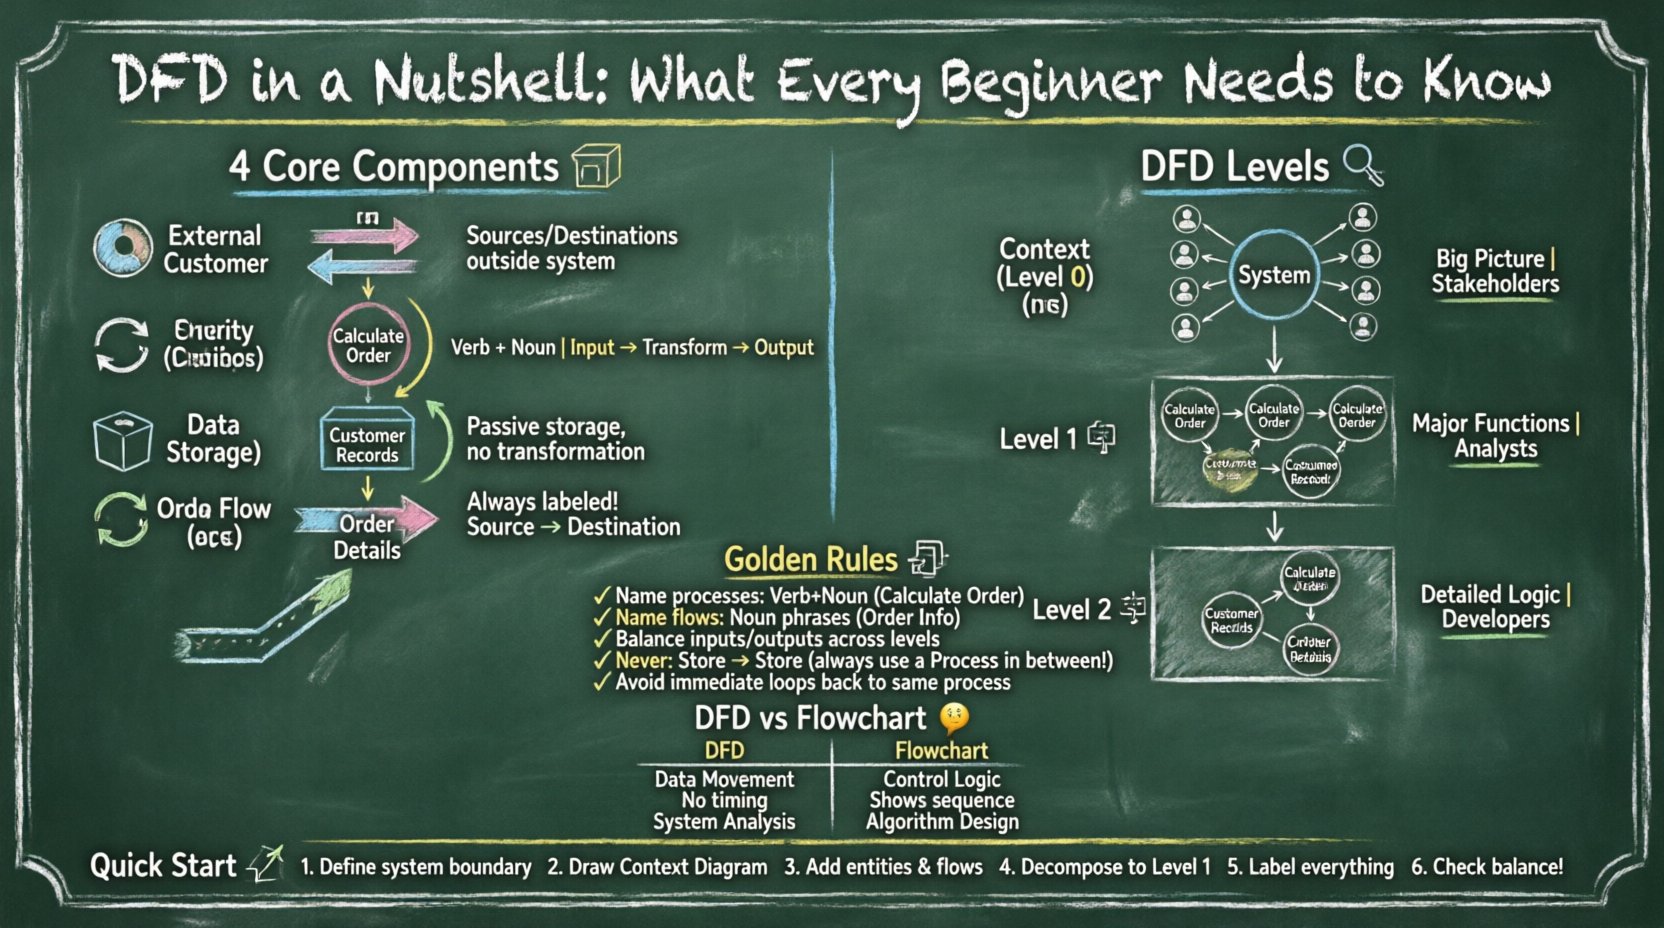
To draw a valid diagram, you must understand the four fundamental shapes and their meanings. These components form the vocabulary of data flow modeling. Each element has a specific role in the system architecture.
External entities represent sources or destinations of data outside the system being modeled. They are also known as terminators or agents. These entities interact with the system but are not part of the internal logic.
An entity must be external. If the entity is part of the system’s internal logic, it should be represented as a process. Confusion here often leads to incorrect boundary definitions.
Processes are actions that transform input data into output data. They represent work being done, calculations, or decision-making logic within the system. A process changes the state or content of the data.
Every process must have at least one input and one output. A process that has only input but no output, or only output but no input, is invalid. This is known as a black hole or a miracle, respectively.
Data stores are where information is held for later use. They do not transform data; they simply store it. This could be a database, a file, a physical file cabinet, or even a temporary holding area.
Data flows can enter and leave a data store, but the store itself does not change the data. It acts as a passive repository. In modern systems, this often correlates with a database table.
Data flows represent the movement of data between entities, processes, and stores. They show the direction of information transfer. A data flow must always be labeled to indicate exactly what information is moving.
A data flow cannot exist without a source and a destination. It cannot float in mid-air. Additionally, data flows should not cross other flows without a specific intersection point, although some notations allow this for simplicity.
Complex systems cannot be represented on a single page. To manage complexity, DFDs are broken down into levels. This technique is called decomposition. It allows you to zoom in on specific areas while maintaining the big picture.
The Context Diagram is the highest level view. It shows the entire system as a single process. It identifies the system name and all external entities interacting with it. There are no data stores or internal processes shown in this view.
The Level 1 diagram explodes the single process from the Context Diagram into major sub-processes. It reveals the main functional areas of the system. This is often the first detailed diagram created.
Level 2 diagrams decompose specific processes from Level 1 further. If a process in Level 1 is complex, it is expanded into multiple sub-processes in Level 2. This continues until the processes are simple enough to be implemented directly.
| Level | Focus | Number of Processes | Primary Audience |
|---|---|---|---|
| Context | System Boundary | 1 | Management, Stakeholders |
| Level 1 | Major Functions | 3 to 7 | Analysts, Designers |
| Level 2 | Sub-Functions | Variable | Developers, Implementers |
Creating a DFD is not just about drawing lines; it is about adhering to logical rules. Violating these rules leads to diagrams that are technically incorrect and confusing. Adhering to standard conventions ensures consistency across documentation.
Every element must be clearly named to avoid ambiguity. Poor naming is the most common error in beginner diagrams.
Consistency in naming allows readers to trace data across multiple levels of the diagram without confusion.
Balancing is a critical rule when moving from one level to the next. The inputs and outputs of a parent process must match the inputs and outputs of the child diagram created by decomposing it.
Always check the arrows entering and leaving the boundary of a decomposed process against the parent process.
Data flows into and out of data stores. However, a data flow cannot go directly from one data store to another without a process in between. A process must be the intermediary to transform or route the data.
This rule ensures that data is not simply moved without purpose. Every movement should imply some logic or action is being performed.
While loops are common in programming, in DFDs, they can indicate a design flaw. A data flow should not return immediately to the same process without passing through other components. If a flow returns, it implies a delay or a different process is needed.
Beginners often confuse Data Flow Diagrams with Flowcharts. While both use similar shapes like boxes and arrows, their purposes are fundamentally different.
| Feature | Data Flow Diagram (DFD) | Flowchart |
|---|---|---|
| Focus | Data Movement | Control Logic |
| Decision Points | Not shown explicitly | Central component (Diamond shape) |
| Process | Transformation of data | Sequence of steps |
| Time | Does not show sequence | Shows sequence and timing |
| Context | System Analysis | Algorithm or Procedure |
If you need to show what happens to the data, use a DFD. If you need to show how the system decides what to do next, use a Flowchart. Using a DFD to map control logic often leads to cluttered and unreadable diagrams.
Once you understand the theory, the practical application follows a logical sequence. You do not need expensive software to start; paper and pencil work just as well for early drafts.
Even experienced analysts make mistakes. Being aware of common errors can save significant time during the review phase.
Data Flow Diagrams are not suitable for every situation. Understanding the appropriate context for their use is key to effective documentation.
A DFD is not a one-time deliverable. Systems change, and so should your diagrams. Maintenance involves keeping the documentation synchronized with the actual software.
By maintaining accurate diagrams, you reduce the risk of errors during future updates. A stale diagram is often worse than no diagram at all, as it misleads the development team.
Data Flow Diagrams are a powerful tool for visualizing system behavior. They focus on the movement of data rather than the control logic. By mastering the four core components—External Entities, Processes, Data Stores, and Data Flows—you can create clear and effective models. Remember to decompose complex systems into levels, maintain strict naming conventions, and adhere to the balancing rule. Avoid common pitfalls like ghost flows and control logic. With practice, you will be able to map complex information systems with confidence and clarity.