 Visual Paradigm Desktop |
  Visual Paradigm Online


Data Flow Diagrams (DFDs) are fundamental tools in systems analysis and design. They provide a visual representation of how information moves through a system. Understanding the depth of a DFD is critical for ensuring that requirements are captured accurately. This guide explores the process of moving from a high-level Context Diagram down to a detailed Level 1 Diagram. We will examine the principles of decomposition, data conservation, and structural integrity without relying on specific software tools.
DFDs are not flat documents; they exist in a hierarchy. This structure allows analysts to view a system from different levels of detail. Each level adds more specificity to the processes and data flows.
The transition from Context to Level 1 is often the most challenging step for new analysts. It requires balancing the need for clarity with the need for detail. If the diagram is too high, it lacks actionable information. If it is too low, it becomes cluttered and loses the big picture.
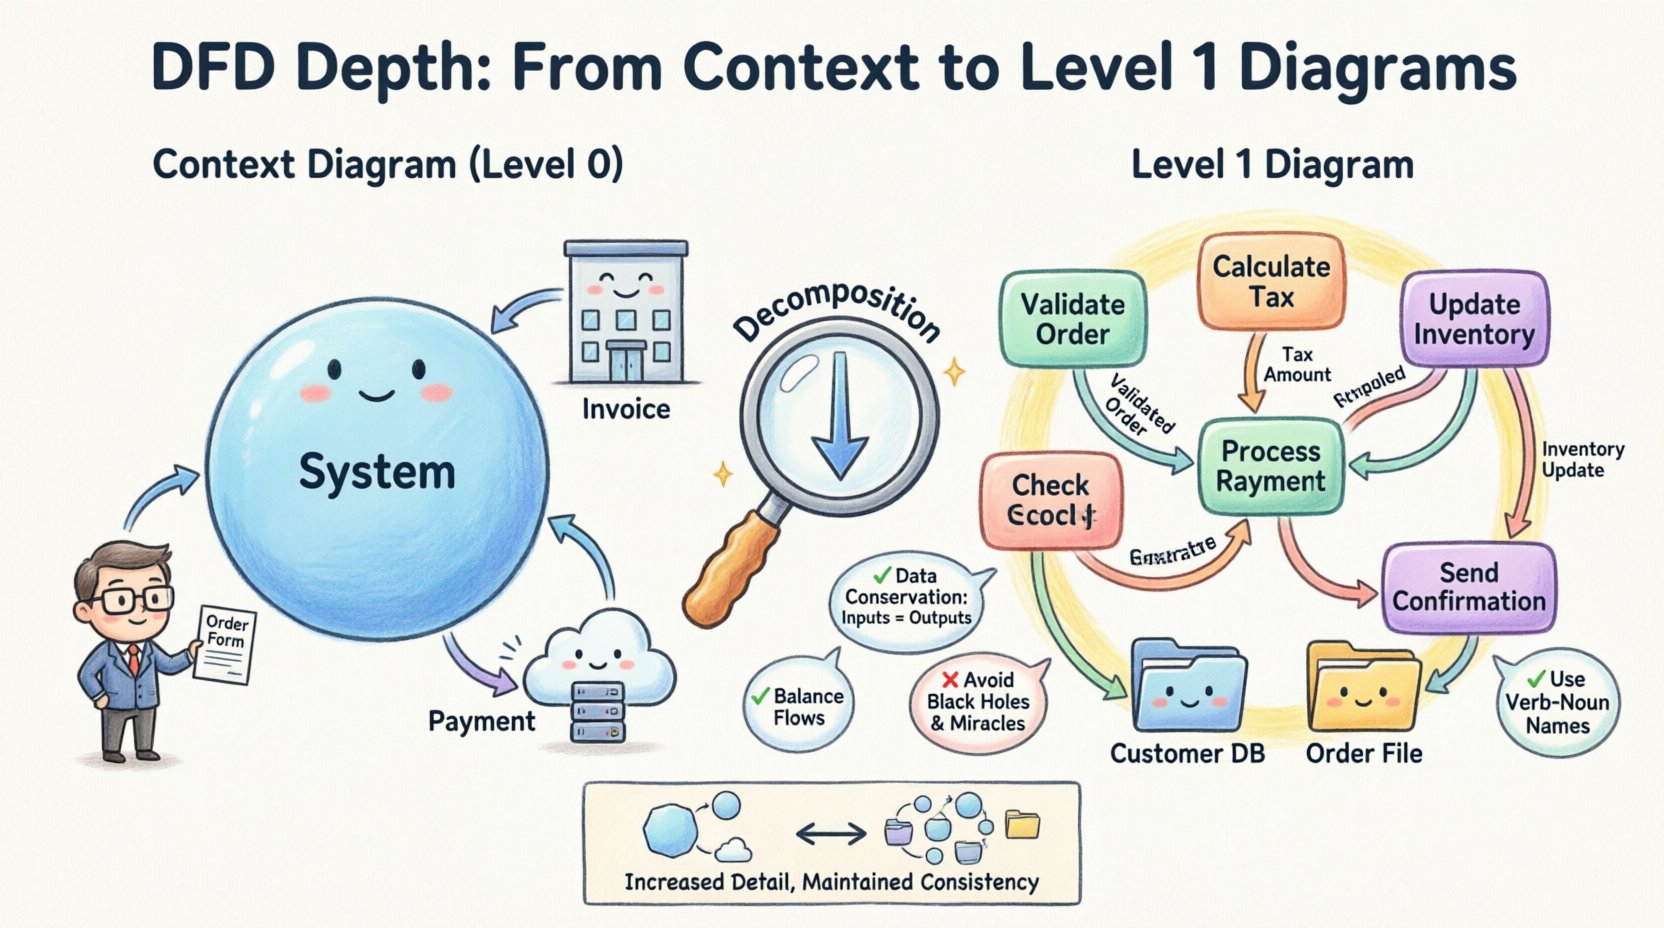
The Context Diagram serves as the anchor for the entire DFD suite. It defines the boundary of the system under study. Everything inside the circle is part of the system; everything outside is external.
Establishing the boundary is crucial. An entity is external if it is outside the scope of the current project. For example, in a payroll system, the tax authority might be an external entity, but the finance department might be internal. Misidentifying boundaries leads to scope creep and confusion.
Decomposition is the process of breaking a complex process into smaller, more manageable sub-processes. This is the core mechanism for creating a Level 1 Diagram. It is not just about splitting tasks; it is about revealing the internal logic of the system.
When moving from Level 0 to Level 1, several rules must be followed to maintain logical consistency.
One of the most critical technical requirements is data flow balancing. The data entering the Level 0 process must equal the data entering the Level 1 processes. Similarly, the data leaving the Level 0 process must equal the data leaving the Level 1 processes.
If the Context Diagram shows an “Order Form” entering the system, the Level 1 Diagram must show that same “Order Form” entering one of the sub-processes. If the Level 1 Diagram shows a “Customer ID” being passed internally, it cannot be an external input or output in the Level 0 diagram unless it was present there.
Once the decomposition plan is ready, the actual construction begins. This involves identifying the major functional areas of the system.
Look at the single process from the Context Diagram. Ask: What are the main activities required to fulfill the system’s purpose? These become the bubbles or circles in the Level 1 Diagram.
Connect the processes with arrows. These arrows represent the movement of data between the internal processes. You may also draw arrows connecting external entities to these new sub-processes.
While Context Diagrams exclude them, Level 1 Diagrams frequently include data stores. A data store is where data is held at rest. It could be a database, a file, or a physical filing cabinet.
When drawing data stores:
Even experienced analysts encounter errors when creating DFDs. Recognizing these patterns early saves time during validation.
A black hole is a process that has inputs but no outputs. This implies that data is being consumed without producing a result. In a functional system, every input must result in some form of output or data storage.
A miracle is a process that has outputs but no inputs. This implies that data is being generated from nothing. Every output must be derived from some input data.
DFDs track data flows, not control flows. A control flow represents a signal to start or stop a process (e.g., “Start Button Pressed”). If you see a flow that looks like a control signal, it is likely actually data (e.g., “Start Request”). DFDs do not handle timing or logic control explicitly.
This occurs when the inputs to the Level 1 diagram do not match the inputs of the Context Diagram. Always verify the conservation of data after drawing the Level 1 diagram.
The following table summarizes the differences between the levels to aid in understanding when to use which.
| Feature | Context Diagram (Level 0) | Level 1 Diagram |
|---|---|---|
| Central Process | One single process | Multiple sub-processes |
| Data Stores | None | Yes, included |
| Detail Level | High-level summary | Functional breakdown |
| External Entities | All primary entities | Subset or same entities |
| Primary Purpose | Define system scope | Define internal logic |
After the initial draft, the diagram must be validated. This is not a one-time check but a cycle of review and refinement.
As you move deeper into the DFD structure, you will face decisions about granularity. How deep should you go?
There is no universal rule, but general guidelines exist:
Data stores can complicate the visual flow. Ensure they are placed logically. Do not draw a line crossing through a process. If a line must cross a process, use a connector point or a junction symbol to indicate it is passing by, not interacting.
Distinguish between actors inside the system and those outside. If a human operator is part of the system workflow (e.g., a clerk entering data), they might be an internal actor, but often they are represented as an external entity because they are outside the software boundary. Consistency in this definition is key.
The diagram is only part of the story. Textual descriptions are required to explain the logic.
Successfully moving from Context to Level 1 requires a disciplined approach. It is not about drawing more boxes; it is about revealing the truth of the system.
By following these structured steps, you create a robust foundation for system design. The Level 1 Diagram becomes the blueprint for developers and a communication tool for business stakeholders. It bridges the gap between abstract requirements and concrete implementation.