Data Flow Diagrams (DFDs) serve as the backbone of system design and analysis. They provide a visual representation of how information moves through a system, highlighting processes, data stores, and external interactions. However, a diagram is only as good as its accuracy and clarity. Without rigorous validation, a DFD can lead to misaligned expectations, development errors, and security gaps.
This guide provides a comprehensive checklist to validate your Data Flow Diagrams. We will examine every aspect of the diagram, from structural integrity to logical consistency, ensuring your documentation is not just a drawing, but a functional tool for engineering and communication. 🛠️
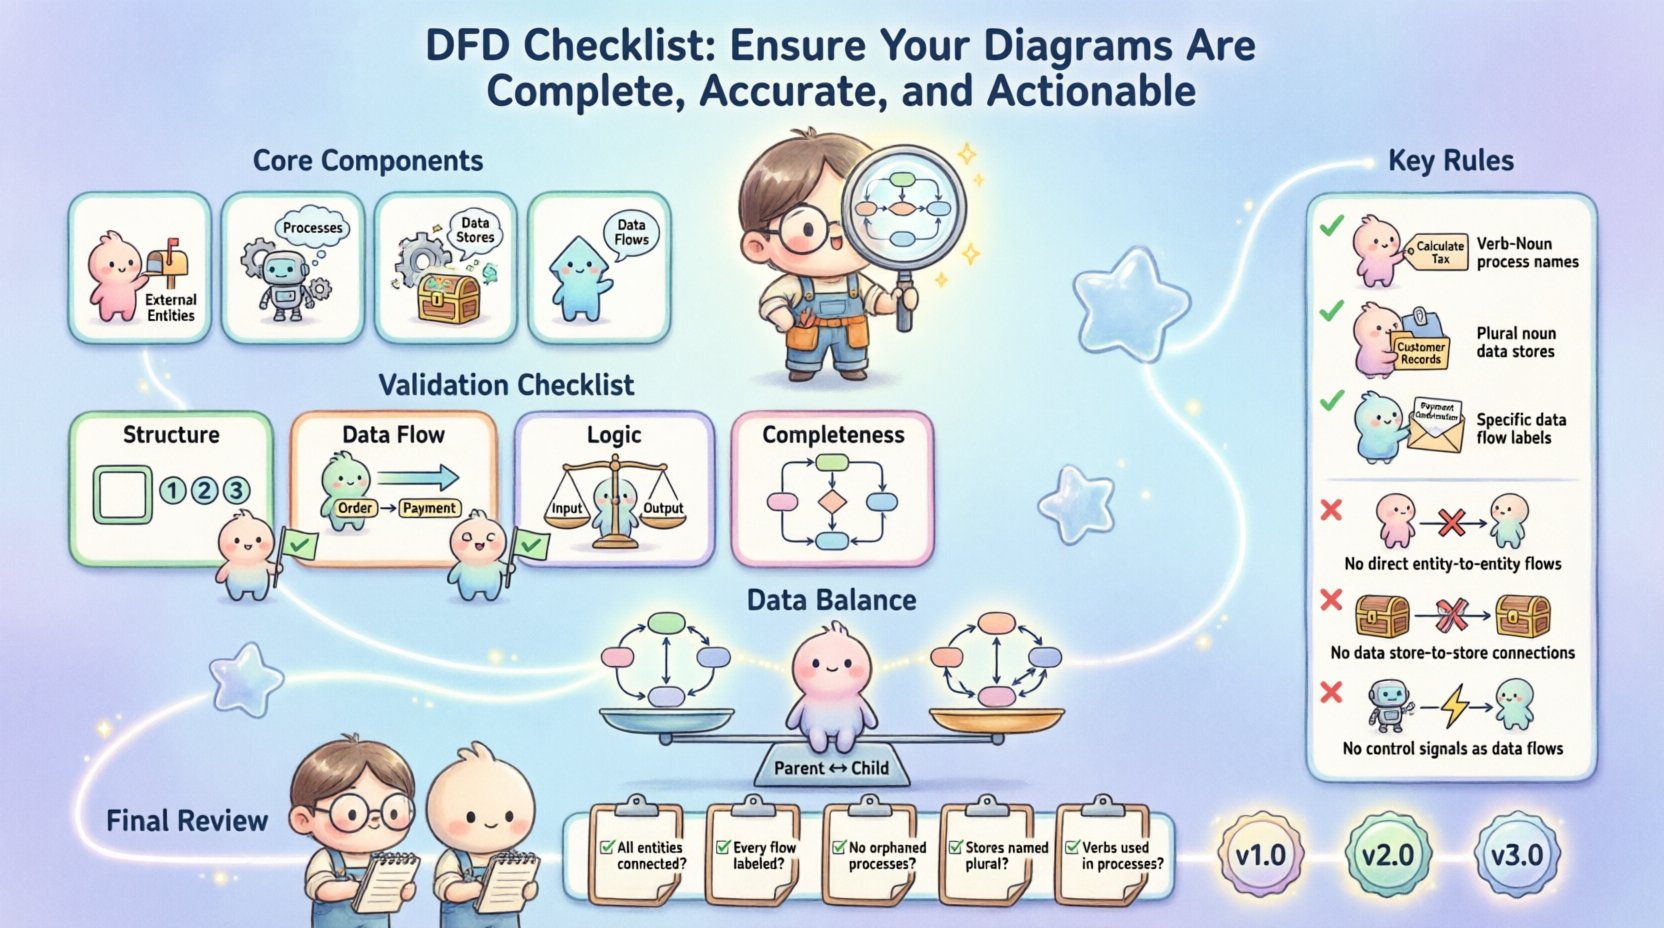
Understanding the Core Components 🧩
Before applying the checklist, it is essential to verify that the fundamental elements are present and correctly defined. A valid DFD relies on four specific components. If any are missing or misused, the integrity of the diagram is compromised.
- External Entities: These are sources or destinations of data outside the system boundary. They represent users, other systems, or hardware devices that interact with the system.
- Processes: These represent actions or transformations applied to the data. They take input data, modify it, and produce output data.
- Data Stores: These represent where data is held at rest. They include databases, files, or physical archives.
- Data Flows: These are the arrows connecting the components, indicating the direction of information movement.
Each component must adhere to specific notational rules. While notation styles vary, the underlying logic remains consistent. Ensure you are familiar with the specific standard being used in your organization, whether it is Gane and Sarson or Yourdon and DeMarco.
Pre-Diagram Preparation 📝
Validation begins before the first arrow is drawn. A well-prepared environment reduces errors during the diagramming phase. Use the following preparation steps to set a strong foundation.
- Define the System Boundary: Clearly identify what is inside the system and what is outside. This determines what processes are included and which entities are external.
- Identify Stakeholders: Know who will review the diagram. Developers need different details than business analysts.
- Establish Naming Conventions: Agree on naming standards for processes, data flows, and stores before starting. Consistency prevents confusion later.
- Scope the Decomposition: Decide how many levels of detail are required. A single diagram cannot show everything; plan the hierarchy.
The Comprehensive Validation Checklist ✅
Use this table as a reference during your review process. It covers the critical areas that require scrutiny to ensure the diagram is functional and accurate.
| Category |
Check Item |
Validation Criteria |
| Structure |
Boundary Definition |
System limits are clearly marked with a distinct line or box. |
| Structure |
Process Count |
Processes are numbered sequentially (e.g., 1.0, 2.0, 3.0). |
| Data Flow |
Arrow Direction |
All flows have a clear start and end point; no floating arrows. |
| Data Flow |
Data Labeling |
Every arrow has a descriptive noun phrase, not a verb. |
| Logic |
Process Input/Output |
Every process must have at least one input and one output. |
| Logic |
Data Store Access |
Data stores must have both a read (input) and write (output) flow. |
| Completeness |
External Entity Reachability |
Every external entity is connected to at least one process. |
| Completeness |
Data Store Isolation |
Data flows do not connect directly to other data stores. |
1. Structural Integrity 🔨
The physical layout of the diagram must support the logical flow. A chaotic diagram often leads to a chaotic understanding of the system.
- Sequential Numbering: Ensure all processes are numbered logically. Level 0 should start with 0.0 or 1.0. Decomposed processes should follow a parent-child hierarchy (e.g., 1.1, 1.2).
- Consistent Shapes: If using rectangular shapes for processes, ensure they are not confused with data stores. If using circles or rounded rectangles, maintain consistency throughout the document.
- No Orphaned Components: Check that every shape is connected to at least one other element. Isolated processes or entities indicate a broken workflow.
2. Data Flow Accuracy 🔄
Data flows are the veins of the diagram. If they are incorrect, the entire system logic is flawed.
- Noun Phrases Only: Labels on data flows should be nouns (e.g., “Order Details”), not verbs (e.g., “Process Order”). Verbs belong on the processes themselves.
- Bidirectional Flows: If a single arrow connects two components, ensure the data is truly flowing in both directions. If the data moves differently in each direction, split them into two separate arrows with distinct labels.
- Ghost Flows: Remove any data flow that does not carry actual information. A line connecting two processes that conveys no data is noise.
- Control vs. Data: Distinguish between control signals and data. Control signals (like “Start” or “Stop”) are not data. If they represent a state change, they should be modeled differently or documented separately.
3. Process Logic Validation ⚙️
Processes transform data. If the transformation logic is flawed, the output will be useless.
- Black Hole Check: Ensure no process consumes data without producing any. A process that takes data in and does nothing with it is a black hole and should not exist.
- Gray Hole Check: Ensure no process produces data without consuming any. A process that generates output from nothing is a gray hole (magic).
- Transformation Clarity: The input data and output data should be different. If the output is identical to the input, the process might be redundant unless it adds metadata or timestamps.
- Decision Points: DFDs typically do not show internal logic like “if/else” statements. If a process involves branching logic, it should be described in a separate specification document, not drawn as a diamond shape (which belongs in flowcharts).
Ensuring Data Balance ⚖️
One of the most critical technical requirements in DFDs is balancing. Balancing ensures that the data entering and leaving a parent process matches the data entering and leaving its child processes in a lower-level diagram.
Why Balancing Matters
Without balancing, information is lost or created during decomposition. This leads to discrepancies between the high-level overview and the detailed implementation plan.
How to Validate Balance
- Input Matching: The sum of data flows entering a child diagram must equal the data flows entering the parent process.
- Output Matching: The sum of data flows leaving a child diagram must equal the data flows leaving the parent process.
- Data Store Consistency: If a parent process accesses a data store, the child processes accessing that same store must maintain the same input/output relationship.
- Re-verification: Every time you decompose a process, you must re-check the balance. It is easy to lose a data flow during the zoom-in process.
Naming Conventions & Clarity 🏷️
A diagram is a communication tool. If the names are ambiguous, the communication fails. Clear naming conventions reduce the need for verbal explanations during reviews.
Process Naming
- Verb-Noun Structure: Name processes with a verb followed by a noun (e.g., “Calculate Tax”, “Update Inventory”).
- Unique Names: Avoid generic names like “Process 1” or “Do Something”. Every process should have a unique, descriptive name.
- Consistency: If you call it “Validate User” in one diagram, do not call it “Check Login” in another. Use the same terminology across all levels.
Data Store Naming
- Noun Phrases: Data stores should be named with plural nouns (e.g., “Customer Records”, “Order Logs”).
- Logical vs. Physical: Do not name data stores based on physical implementation (e.g., “SQL_Table_1”). Use logical names that describe the content (e.g., “Customer Database”).
- Uniqueness: Ensure no two data stores share the exact same name, even if they are in different diagrams.
Data Flow Naming
- Specific Data: Do not label a flow as “Data”. Be specific (e.g., “Shipping Address”, “Payment Confirmation”).
- State Changes: If data changes state (e.g., “Draft Order” becomes “Final Order”), the data flow label should reflect this distinction or the process should be named to reflect the transformation.
Common Pitfalls to Avoid ⚠️
Even experienced analysts fall into traps. Here are the most common errors that compromise the quality of a DFD.
- Direct Entity-to-Entity Flows: Data cannot flow directly from one external entity to another without passing through a process within the system boundary. This bypasses the system logic.
- Data Store-to-Data Store Flows: Data cannot move directly from one data store to another. It must be read by a process, transformed, and then written to the new store.
- Confusing Control and Data: Signals like “Click Button” or “Timeout” are events, not data. They should not be drawn as data flows unless they carry information payload.
- Over-Complexity: Avoid putting too much detail on a single diagram. If a diagram has more than 7 to 9 processes, it is likely too complex for a single view. Use decomposition to break it down.
- Missing Context: Never present a Level 1 or Level 2 diagram without providing the Context Diagram (Level 0) as a reference point.
Stakeholder Verification 🤝
Technical accuracy is only half the battle. The diagram must be understood by the people who will build and use the system. Verification involves active engagement with stakeholders.
- Walkthroughs: Schedule sessions where you trace the data flow verbally with the stakeholder. Ask them to trace a specific transaction from start to finish.
- Question Prompts: Ask questions like, “What happens if this data is missing?” or “Where is this information stored?” to test the robustness of the diagram.
- Gap Analysis: Compare the diagram against the requirements document. Ensure every requirement that involves data movement is represented visually.
- Developer Feedback: Have the technical team review the diagram for feasibility. They may identify data storage bottlenecks or logical impossibilities that business analysts miss.
Maintenance & Version Control 🔄
Systems evolve. Requirements change. A DFD is a living document, not a static artifact. Proper maintenance ensures the diagram remains actionable over time.
- Versioning: Assign version numbers to your diagrams (e.g., v1.0, v1.1). Document the date of change and the reason for the update.
- Change Logs: Maintain a separate log of changes. Note which processes were added, removed, or renamed. This helps in auditing and debugging later.
- Sync with Requirements: Whenever a requirement changes, update the diagram immediately. Do not let the diagram drift away from the requirements.
- Archive Old Versions: Keep previous versions accessible. If a new feature breaks an old workflow, the old diagram serves as a reference for the legacy behavior.
Final Review Steps 🔍
Before finalizing the documentation, perform a final sweep using this quick checklist.
- Are all processes numbered correctly?
- Is every data flow labeled with a noun phrase?
- Are all data stores accessible from at least one process?
- Is the diagram balanced across all levels?
- Are external entities connected only to processes?
- Is the system boundary clearly defined?
- Are there any floating elements or disconnected components?
- Is the notation consistent throughout the document?
By adhering to these guidelines, you ensure that your Data Flow Diagrams are not just illustrations, but reliable blueprints for system architecture. A well-validated DFD reduces development rework, clarifies communication, and ensures the final product meets the intended data requirements.
 Visual Paradigm Desktop |
  Visual Paradigm Online