 Visual Paradigm Desktop |
  Visual Paradigm Online


Data Flow Diagrams (DFDs) remain a cornerstone of systems analysis and design. They provide a visual representation of information flow within a system, highlighting how data enters, moves through processes, and exits. For a systems analyst, mastering the creation of clear, accurate diagrams is not just a technical skill; it is a communication necessity. This guide outlines the essential best practices to ensure your DFDs serve their purpose effectively.
A Data Flow Diagram is a structured modeling technique used to visualize the movement of data through a system. Unlike flowcharts, which focus on control flow and decision-making logic, DFDs focus strictly on data. They answer the questions: where does data come from? What happens to it? Where does it go?
When creating a DFD, the goal is to abstract complexity. You are mapping the business logic without getting bogged down in implementation details like code, database schemas, or specific hardware. This abstraction allows stakeholders to understand the system without needing technical expertise.
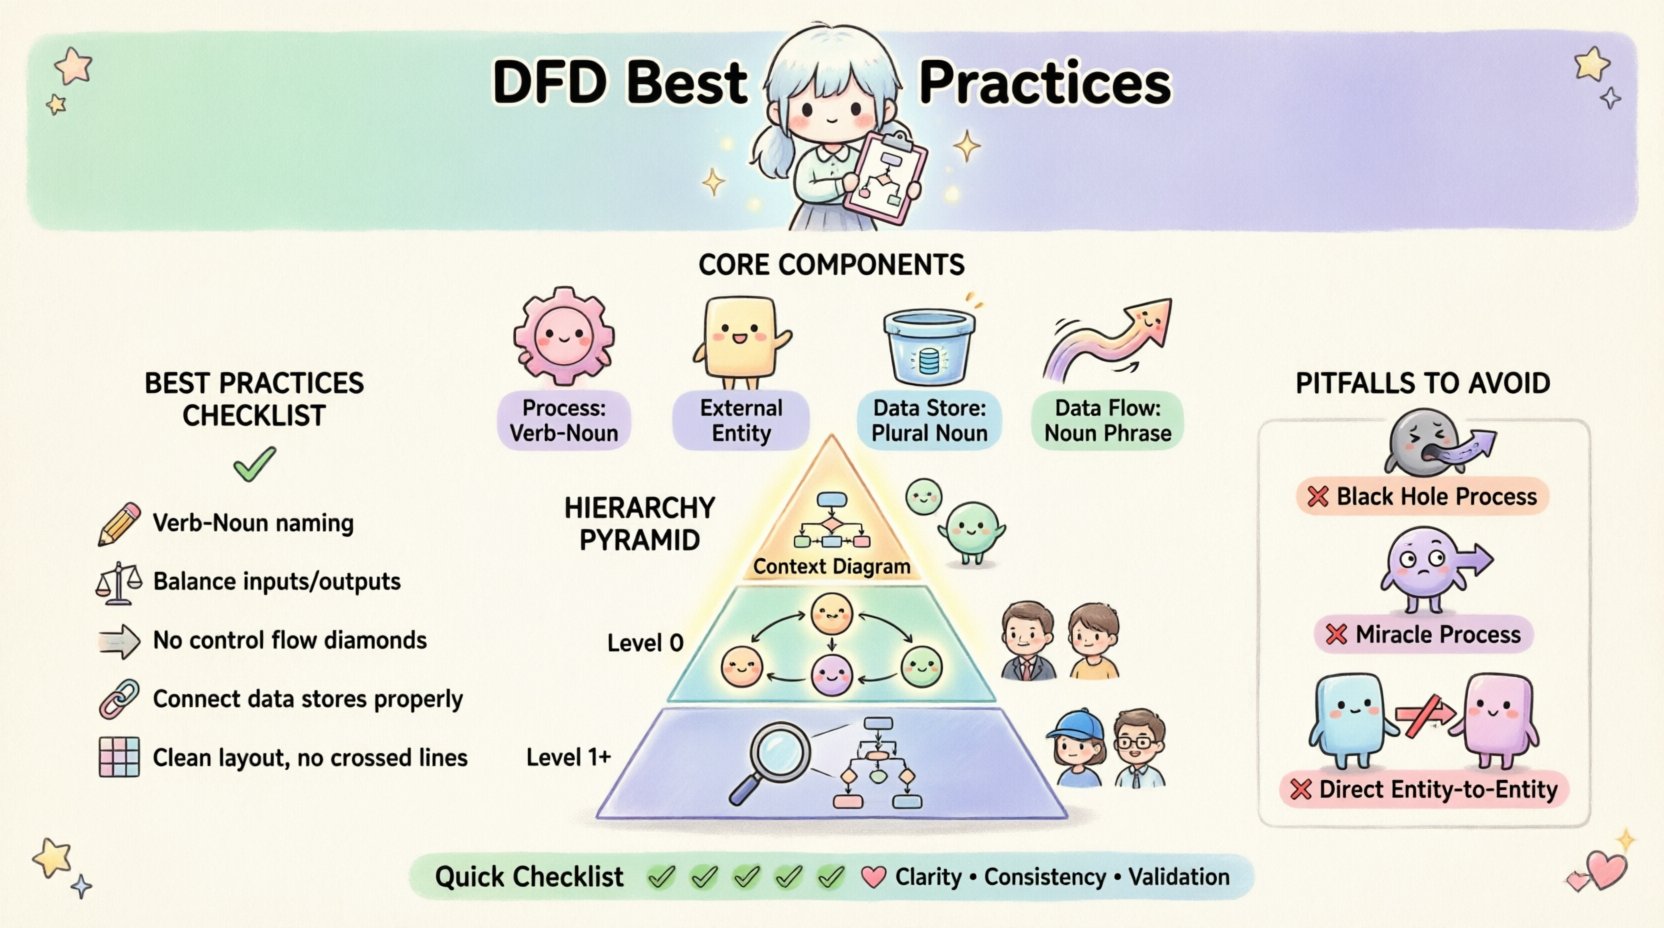
Regardless of the specific methodology used (such as Yourdon & DeMarco or Gane & Sarson), all DFDs rely on a standard set of symbols. Understanding these components is the first step toward best practices.
| Component | Symbol Shape | Function |
|---|---|---|
| Process | Circle or Rounded Rectangle | Transforms input data into output data. |
| External Entity | Rectangle | Source or destination of data outside the system. |
| Data Store | Open-ended Rectangle | Stores data for later use (files, databases). |
| Data Flow | Arrow | Shows the movement of data between components. |
Complex systems cannot be represented in a single view. DFDs are hierarchical. Breaking them down into levels allows for progressive refinement.
This is the highest level view. It represents the entire system as a single process. It shows the system boundaries and how it interacts with external entities. It does not show internal processes or data stores.
This diagram explodes the single process from the Context Diagram into major sub-processes. It introduces data stores and shows how data moves between major functional areas.
These diagrams drill down further into specific processes from Level 0. They are used for detailed design and implementation guidance.
| Level | Detail | Primary Audience |
|---|---|---|
| Context | High-Level | Management, Stakeholders |
| Level 0 | Functional | Project Managers, Architects |
| Level 1+ | Detailed | Developers, Testers |
To create DFDs that are robust and maintainable, adhere to these structural and logical rules.
Labels are critical. A reader should understand the diagram without needing a legend. Ambiguity leads to development errors.
Conservation of data is a fundamental rule. The data entering a process must equal the data leaving it, transformed but not lost. You cannot have a process that creates data from nothing (magic) or deletes data without a record (unless explicitly designed).
A common mistake is mixing decision logic into the data flow. DFDs show what data moves, not how decisions are made. If a decision is required, it should be documented in a separate specification or decision table, not as a diamond symbol on the DFD.
Data must flow to and from data stores. A process cannot simply exist in a vacuum.
Visual clarity is paramount. A diagram that looks like a plate of spaghetti is useless.
Even experienced analysts make mistakes. Being aware of common traps helps you maintain high quality.
A process that has inputs but no outputs. This implies data is being consumed without producing any result. This is logically impossible in a functioning system unless the data is being discarded, which must be explicitly shown.
A process that has outputs but no inputs. This suggests data is appearing out of thin air. Every output must have a source.
External entities should not pass data directly to each other without passing through the system. If Entity A gives data to Entity B, it must enter the system, be processed, and then leave.
If you call a flow “User Data” in the Context Diagram, do not call it “Customer Info” in the Level 0 diagram. Consistency ensures traceability.
Do not detail every single step in a Level 0 diagram. Keep it at a functional level. If you are listing every button click, you are building a UI wireframe, not a DFD.
DFDs are not created in isolation. They must align with business requirements.
A DFD is a living document. Once the system is deployed, the diagram should still be maintained.
To ensure your DFDs are professional and useful, keep this checklist handy during your design sessions.
It is important to distinguish DFDs from other modeling techniques to avoid confusion.
Using the right tool for the right job prevents modeling fatigue and ensures that each diagram serves a distinct purpose in the documentation suite.
Creating Data Flow Diagrams is a balance between technical accuracy and business communication. By following established best practices, you ensure that your diagrams are not just drawings, but functional blueprints for system success. Focus on clarity, consistency, and validation. When stakeholders can look at your diagram and say, “Yes, that is exactly how we work,” you have achieved the goal.
Remember that the diagram is a means to an end, not the end itself. The value lies in the understanding it generates and the errors it helps prevent before code is ever written. Prioritize the logic of the data flow, maintain strict naming conventions, and keep the hierarchy logical. With these practices in place, your systems analysis will be robust, clear, and effective.