 Visual Paradigm Desktop |
  Visual Paradigm Online


Strategic planning relies on a clear understanding of the external environment. Within the framework of PEST analysis—Political, Economic, Social, and Technological—the Economic component often dictates the immediate viability of business operations. Tracking the correct economic indicators provides a factual basis for decision-making rather than speculation. This guide details the essential metrics organizations must monitor to maintain resilience and competitive advantage.
Many leaders overlook the nuance of economic data, treating it as a monolithic block. However, specific indicators influence different aspects of an organization uniquely. A robust PEST report requires granularity. It demands that analysts distinguish between broad macroeconomic trends and localized financial shifts. By isolating these variables, businesses can anticipate market shifts before they become critical issues.
The Economic dimension of a PEST analysis examines the financial factors that affect an organization’s performance. These factors are often external and beyond the direct control of the company. They include growth rates, inflation, interest rates, and exchange rates. Understanding these elements allows leadership to forecast revenue, manage costs, and allocate resources effectively.
Ignoring economic data leads to reactive strategies. Proactive planning requires a continuous monitoring system. Organizations that integrate economic indicators into their standard reporting cycles demonstrate higher adaptability. They prepare for downturns and capitalize on upswings with precision.
To build a comprehensive PEST report, specific metrics must be prioritized. Not all data points hold equal weight for every industry. The following list outlines the most critical indicators and their strategic implications.
GDP measures the value of goods and services produced over a specific time. It serves as a primary gauge of economic health. A growing economy typically correlates with increased consumer spending and business investment. Conversely, a shrinking GDP often signals recession.
When tracking GDP in a PEST report, consider the following:
A decline in GDP growth may necessitate a shift in pricing strategy or cost reduction initiatives. It may also suggest a delay in capital expenditure projects. Conversely, strong growth supports expansion plans and aggressive marketing campaigns.
Inflation measures the rate at which the general level of prices for goods and services is rising. It erodes purchasing power and impacts cost structures significantly. High inflation increases operational costs, while low inflation suggests stability.
Key considerations for inflation tracking include:
High inflation requires careful cost management. Organizations may need to pass costs to consumers or absorb them to maintain market share. Deflation poses different risks, such as reduced demand and increased debt burdens.
Interest rates determine the cost of borrowing money. Central banks adjust these rates to control inflation and stabilize the economy. High rates discourage borrowing, while low rates encourage investment.
Strategic impacts of interest rate changes include:
Businesses with significant debt exposure must monitor central bank announcements closely. Adjusting the debt maturity structure can mitigate risk during rate hikes.
For organizations operating across borders, exchange rates are vital. They determine the value of foreign currency relative to the domestic currency. Fluctuations impact import costs and export competitiveness.
Monitoring exchange rates involves:
A weakening domestic currency makes exports cheaper but imports more expensive. A strengthening currency has the opposite effect. This dynamic requires constant review for international supply chains.
Unemployment levels affect labor availability and wage pressures. Low unemployment often drives up wages as companies compete for talent. High unemployment suggests a surplus of labor and potentially lower wage demands.
Factors to evaluate include:
High unemployment can offer a hiring advantage but may signal weak consumer demand. Low unemployment ensures talent availability but increases payroll costs.
This metric gauges how optimistic or pessimistic consumers feel about their financial situation and the economy. It is a leading indicator of spending behavior.
Tracking this index helps forecast demand for non-essential goods and services. It provides early warning signs for revenue shifts before they appear in sales data.
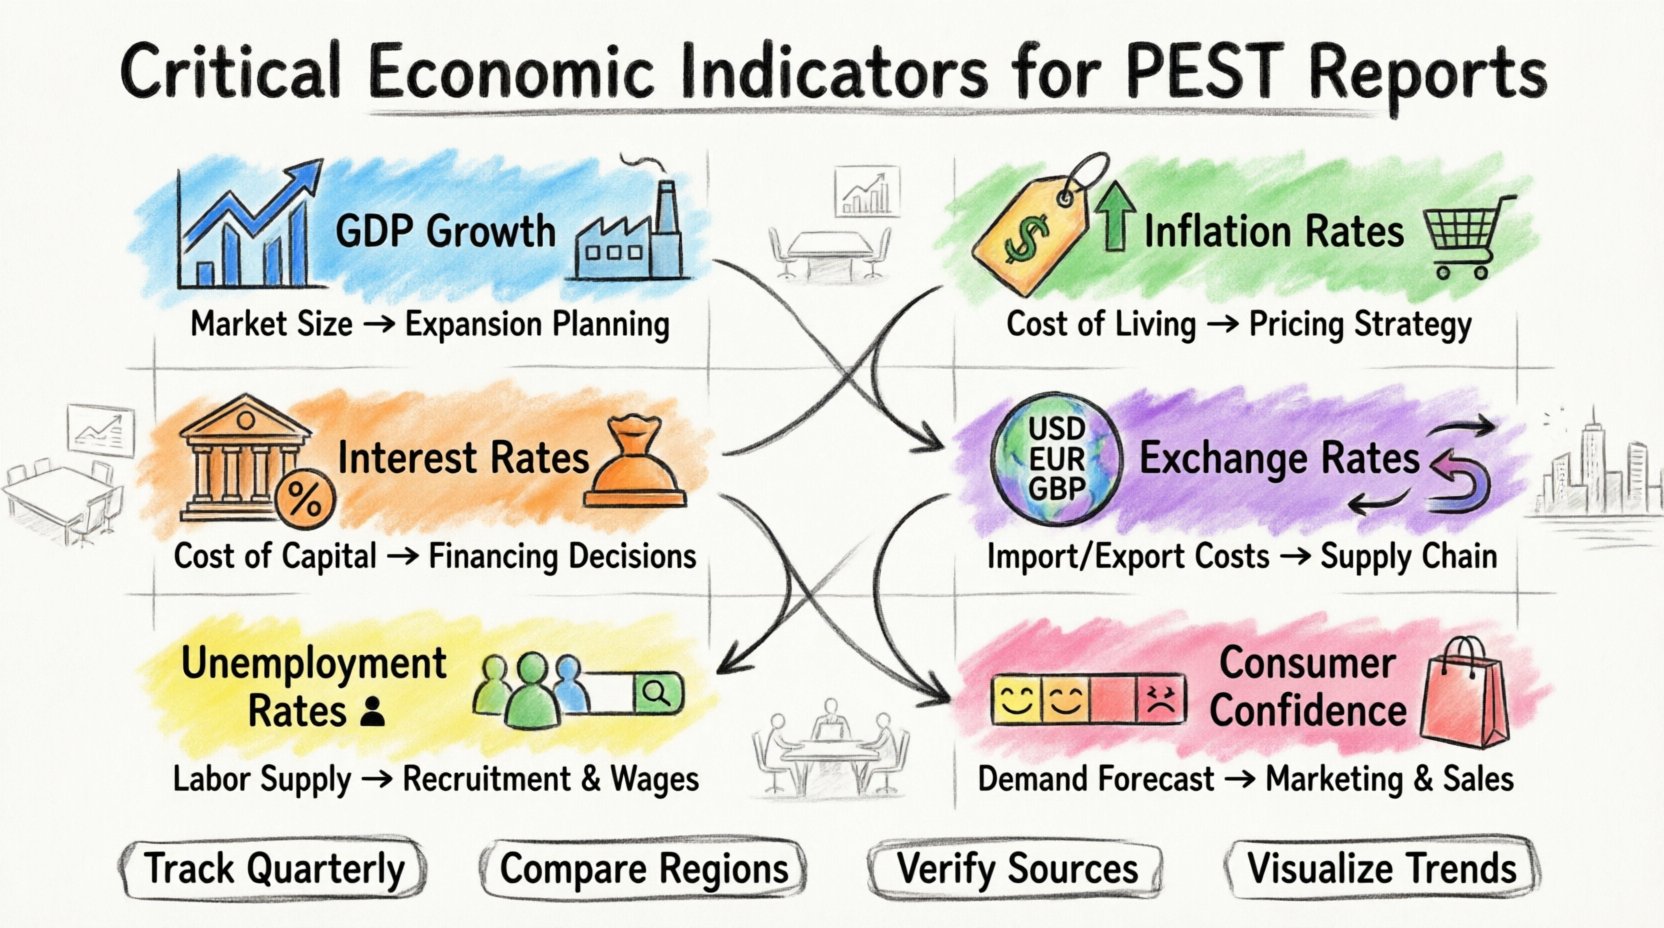
Different indicators serve different strategic purposes. The table below summarizes the primary focus and impact of each metric.
| Indicator | Primary Impact | Strategic Focus |
|---|---|---|
| GDP Growth | Market Size | Expansion Planning |
| Inflation | Cost of Living | Pricing Strategy |
| Interest Rates | Cost of Capital | Financing Decisions |
| Exchange Rates | Import/Export Costs | Supply Chain Management |
| Unemployment | Labor Supply | Recruitment & Wages |
| Consumer Confidence | Demand Forecast | Marketing & Sales |
Collecting data is only the first step. The value lies in synthesizing this information into actionable insights. The process of integration requires a systematic approach to ensure accuracy and relevance.
Reports should not merely list numbers. They must explain the implications. For instance, a rise in inflation should be linked to specific cost centers within the business. It should propose potential mitigation strategies.
Economic conditions vary significantly across geographies. A strategy that works in one region may fail in another. Global organizations must adapt their PEST analysis to local contexts.
Consider these regional factors:
Local economic reports often provide more granular data than national aggregates. Utilizing regional statistics allows for more precise forecasting and risk assessment.
Even experienced analysts can make mistakes when interpreting economic data. Awareness of common errors helps maintain the integrity of the PEST report.
Regularly reviewing the methodology ensures that the analysis remains robust. It is essential to update the data sources and metrics as the economic landscape evolves.
The landscape of economic analysis is changing. New methodologies and data sources are emerging. Organizations must stay informed about these developments to maintain a competitive edge.
Adopting these trends requires investment in infrastructure and talent. However, the payoff is a more responsive and agile strategic planning process. Organizations that embrace these changes can navigate economic uncertainty with greater confidence.
Tracking economic indicators is not a one-time task. It is an ongoing discipline that underpins successful strategic planning. By focusing on the right metrics and interpreting them correctly, businesses can align their operations with market realities.
The goal is not to predict the future with certainty. Instead, it is to prepare for various possibilities. A well-constructed PEST report equips leaders with the knowledge to make informed decisions. It transforms raw data into a strategic asset.
Continual review and adaptation are key. As global conditions shift, so too must the indicators tracked. Organizations that remain vigilant in this area will be better positioned to thrive regardless of the economic climate.
Remember that data is a tool, not a strategy. The insights gained must drive action. Whether it involves cost control, market expansion, or product development, the economic indicators provide the foundation for execution. Keep the analysis grounded, the sources reliable, and the focus on long-term value creation.