 Visual Paradigm Desktop |
  Visual Paradigm Online


Designing a robust information system requires more than just coding; it demands a clear understanding of how data moves through a process. A Data Flow Diagram (DFD) serves as the blueprint for this movement. It visualizes the flow of information between external entities, internal processes, and data stores. This guide provides a deep dive into creating effective DFDs, ensuring your system analysis is structured, logical, and scalable.
Whether you are designing a new application or auditing an existing one, the principles of data flow remain constant. This walkthrough covers the anatomy, levels, creation steps, and best practices required to build professional-grade diagrams without relying on specific tools. The focus remains on the methodology and the logic behind the visualization.
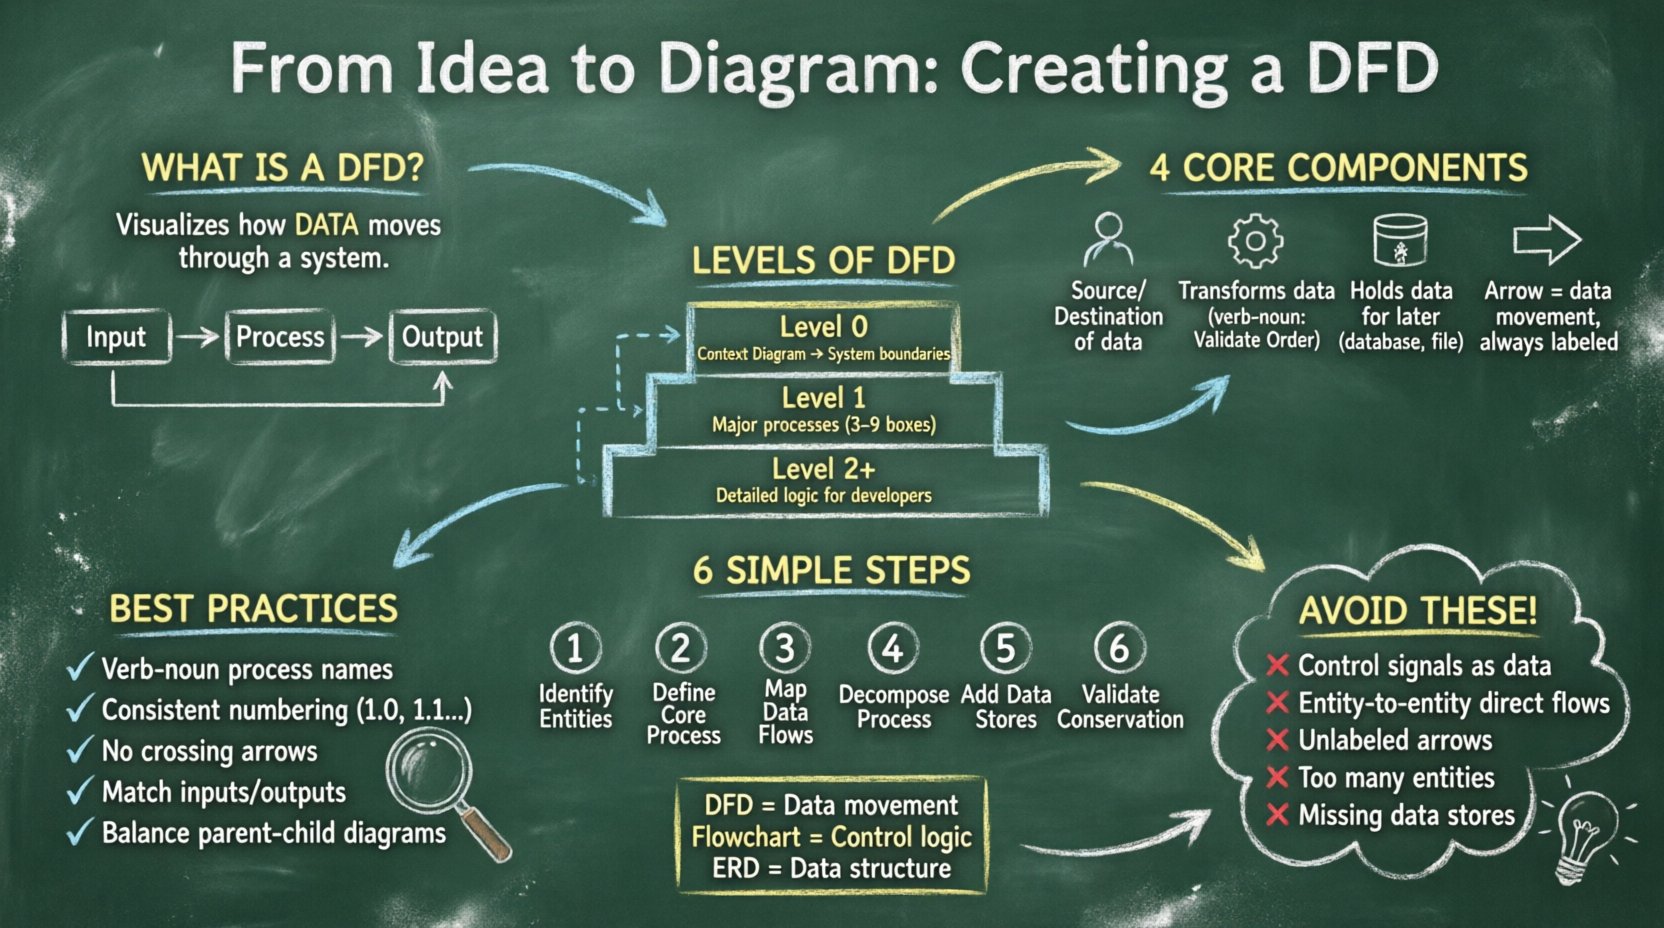
A Data Flow Diagram is a graphical representation of the flow of data through an information system. Unlike a flowchart, which focuses on the control logic and decision-making steps, a DFD focuses on the data itself. It answers the questions: where does the data come from? What happens to it? Where does it go? And where is it stored?
DFDs are integral to structured analysis and design methodologies. They help stakeholders visualize the system boundaries and identify missing data paths or unnecessary complexity. By breaking down complex systems into manageable layers, analysts can ensure that every piece of data has a defined purpose and destination.
To construct a valid DFD, one must understand the four fundamental symbols used throughout the diagram. These symbols are universal and do not change regardless of the notation style used (such as Yourdon/DeMarco or Gane/Sarson). Mastery of these components is essential for accurate modeling.
The following table summarizes the interaction between these components:
| Component | Function | Input Required | Output Required |
|---|---|---|---|
| External Entity | Starts or receives data | No | Yes (or No for sinks) |
| Process | Transforms data | Yes | Yes |
| Data Store | Retains data | Yes (Write) | Yes (Read) |
| Data Flow | Transports data | N/A | N/A |
Complex systems cannot be described in a single view. To manage complexity, DFDs are created at different levels of detail. This technique is known as “decomposition.” You start with a high-level overview and progressively break down processes into sub-processes until the level of detail is sufficient for implementation.
The Context Diagram is the highest level of abstraction. It shows the entire system as a single process and its interaction with external entities. This diagram establishes the boundaries of the system. It answers the question: “What is the system as a whole?”
In the Level 1 diagram, the single process from the Context Diagram is exploded into major sub-processes. This reveals the internal structure of the system without getting bogged down in minute details. It connects the major functional areas to the external entities.
Level 2 diagrams decompose specific processes from Level 1 further. This continues until the processes are simple enough to be understood by developers or operators. A Level 3 or Level 4 diagram might be necessary for highly complex algorithms or financial calculations.
| Level | Focus | Complexity | Primary Audience |
|---|---|---|---|
| Context Diagram | System Boundaries | Low (1 Process) | Stakeholders, Management |
| Level 1 | Major Functional Areas | Medium (3-9 Processes) | Analysts, Project Managers |
| Level 2+ | Specific Sub-processes | High (Detailed Logic) | Developers, Programmers |
Creating a DFD is a methodical process. It is not enough to simply draw shapes; you must follow a logical sequence to ensure data integrity and consistency across all levels.
Begin by listing all the sources and destinations of data. These are the users, other systems, or departments that interact with your system. Avoid placing internal data stores here; keep them separate. Each entity should have a clear name, such as “Customer,” “Admin,” or “Payment Gateway.” Avoid vague terms like “User” if multiple types of users exist.
For the Context Diagram, draw a single circle representing the system. Label it with the name of the system. This is your anchor point. Ensure that all data flows entering and leaving this circle correspond to the entities identified in Step 1.
Draw arrows connecting entities to the process. Label every arrow with the specific data being transferred. Instead of writing “Data,” write “Order Details” or “Invoice.” This specificity is crucial for later development stages. Ensure that no arrow crosses another without a clear connection point.
To create Level 1, replace the single system circle with multiple processes. These processes should represent major functions, such as “Validate Order,” “Process Payment,” and “Update Inventory.” Connect these processes to each other and to the external entities using the data flows identified previously.
Identify where data needs to be saved. If data is required for a later process or for reporting, it must go into a data store. Connect the data store to the process that writes to it and the process that reads from it. Remember, a process cannot write directly to another process; it must go through a store if persistence is needed.
Check every process to ensure that inputs equal outputs. This is the principle of data conservation. You cannot create data out of thin air, nor can you delete it without a record. If a process has inputs but no outputs, it is a “black hole.” If it has outputs but no inputs, it is a “miracle.” Both are errors in the model.
A DFD is a communication tool. If it is confusing to read, it fails its primary purpose. Adhering to strict conventions helps maintain clarity across teams.
Even experienced analysts can make mistakes. Recognizing these common errors early can save significant rework later.
It is common to confuse DFDs with other diagramming methods. Understanding the distinction ensures you use the right tool for the job.
| Diagram Type | Focus | Best Used For |
|---|---|---|
| Data Flow Diagram | Information movement | System requirements, Process logic |
| Flowchart | Control logic, Decisions | Algorithm design, Step-by-step procedures |
| Entity Relationship Diagram | Data structure, Relationships | Database design, Schema definition |
While a Flowchart shows the order of operations (If X, then Y), a DFD shows the dependencies between data transformations. A DFD does not care about the order of execution, only the flow of information. This makes DFDs ideal for analyzing system requirements before logic is finalized.
Systems evolve. Requirements change, and features are added. A DFD created at the start of a project may become outdated. It is vital to maintain the diagram as the system evolves.
Creating a Data Flow Diagram is a discipline that requires patience and precision. It forces you to think about data, not just functions. By following the structured approach outlined above, you ensure that the resulting model is accurate, maintainable, and useful for the entire lifecycle of the system.
Remember that the goal is not to create a perfect picture immediately. It is to create a map that guides the development team. Start with the Context Diagram, validate the boundaries, and then drill down into the details. As you practice, the decomposition process will become more intuitive, and your diagrams will serve as a powerful communication tool for your team.
Keep the focus on the data. Ensure every arrow has a purpose, every process has a transformation, and every store has a reason to exist. This disciplined approach leads to systems that are robust, scalable, and aligned with business needs.