 Visual Paradigm Desktop |
  Visual Paradigm Online


Creating a Data Flow Diagram (DFD) is a critical step in understanding how information moves through a system. These diagrams serve as the blueprint for developers, stakeholders, and analysts. However, a poorly constructed model can lead to confusion, development errors, and system failures. When the flow of data is misrepresented, the logic of the entire application becomes questionable. This guide explores the frequent errors found in DFDs and provides authoritative strategies to correct them.
Many teams rush the modeling phase, assuming that the visual representation is secondary to the code. This approach is flawed. A DFD defines the logic before a single line of code is written. If the diagram is broken, the software built upon it will inherit those structural weaknesses. We will examine the specific categories of mistakes that compromise model integrity and offer clear pathways to resolution.
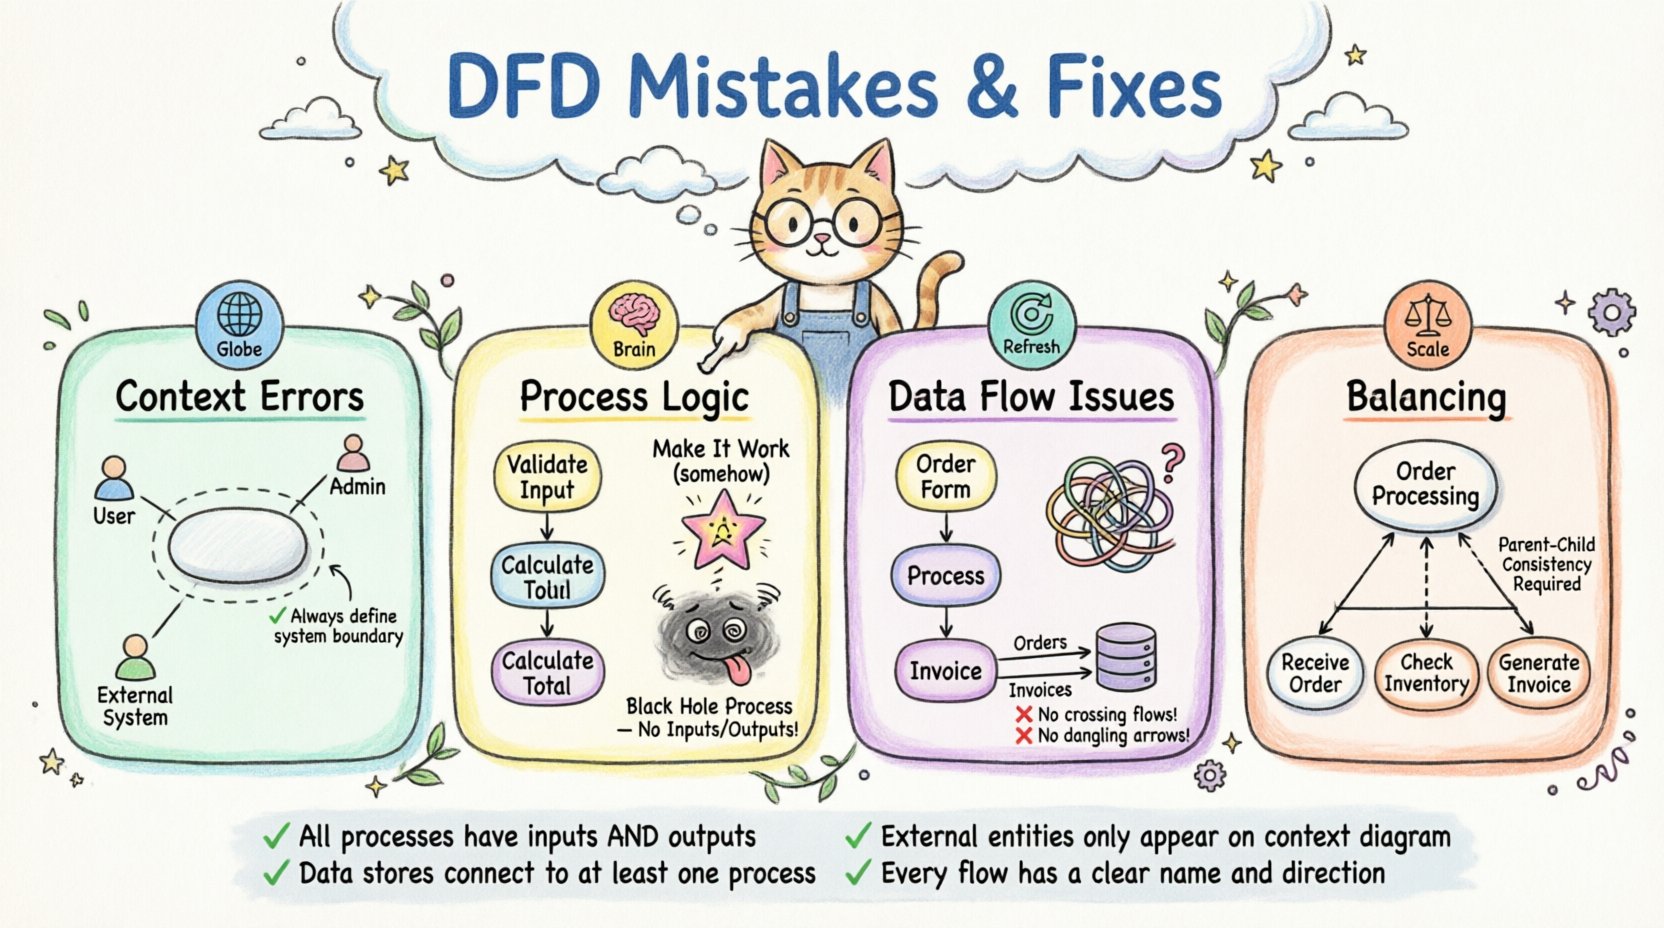
The context diagram is the highest-level view of the system. It represents the entire system as a single process and shows how it interacts with the outside world. Errors here set a bad foundation for all subsequent levels.
External entities represent users, other systems, or organizations that interact with your system. A common mistake is omitting a critical entity. If you forget a user group or an external API, the requirements are incomplete.
The system boundary must be defined clearly. Sometimes, processes are drawn outside the system that should be inside, or vice versa. This creates ambiguity about where the responsibility lies.
Processes transform data. They are the active components of the diagram. Naming and defining these processes incorrectly is one of the most damaging errors.
Process names should follow a Verb-Noun structure. A name like “Sales” is a noun. A name like “Calculate Sales” is a verb-noun phrase. This distinction clarifies what action is taking place.
A magic process is a process that has inputs but no outputs, or outputs but no inputs. It creates data from nothing or consumes data without returning a result.
A black hole occurs when data flows into a process but no data flows out. The information disappears into the void.
This is the opposite of a black hole. Data appears from nowhere without an input. It implies the system creates information without a source.
The arrows in a DFD represent the movement of data. How these arrows are drawn and labeled is crucial for understanding the system’s behavior.
When data flow lines cross each other without an intersection node, it creates visual clutter and confusion. It is unclear if the data merges or simply passes by.
Data stores represent places where information is saved. A common mistake is connecting a data flow to a store without a process in between.
A dangling flow is an arrow that ends in mid-air. It does not connect to a process, entity, or store.
Complex systems are often broken down into lower-level diagrams. This is called leveling. Balancing ensures that the inputs and outputs remain consistent between levels.
When decomposing a high-level process into lower-level processes, the total inputs and outputs of the child level must match the parent.
Placing too many processes in a single diagram makes it hard to read. Ideally, a diagram should focus on a specific function or module.
Process names must remain consistent across levels. If a process is named “Validate User” at Level 0, it should not be renamed at Level 1.
Creating a diagram is only half the battle. Validating it ensures that the model accurately reflects the business needs.
A walkthrough involves walking through the diagram with stakeholders. Trace a piece of data from entry to exit. Does the path make sense?
Ensure that the terminology used in the diagram matches the terminology used in the requirements document.
The following table summarizes the most critical mistakes and their fixes.
| Mistake Type | Description | Impact | Correction |
|---|---|---|---|
| Magic Process | Process with no inputs or outputs | Impossible Logic | Add missing flows |
| Black Hole | Data enters but does not leave | Data Loss | Ensure output exists |
| Spontaneous Generation | Data appears without input | Inconsistent Data | Trace data origin |
| Imbalanced Leveling | Child inputs differ from Parent | Requirement Drift | Reconcile flows |
| Unclear Naming | Noun-only process names | Ambiguity | Use Verb-Noun |
| Direct Store Connection | Entity connects to Store | Logic Error | Route through Process |
Once the model is complete, it requires maintenance. Systems evolve, and diagrams must evolve with them.
Keep track of changes to the diagram. A new version should be saved whenever significant changes are made.
Link the diagram to detailed documentation. A bubble might represent a complex algorithm that needs its own spec.
Schedule regular reviews of the DFD to ensure it matches the current system state.
Building a robust Data Flow Diagram requires attention to detail and a disciplined approach. By avoiding the common pitfalls outlined above, you ensure that your system model is a reliable tool for communication and development. The effort spent on correcting these errors early saves significant time during the coding phase. Focus on clarity, consistency, and logical completeness.
Remember that a DFD is a living document. It should not be treated as a one-time artifact. As the system changes, the diagram must be updated to reflect the new reality. This continuous alignment ensures that the model remains a valid representation of the system.
Adopting these practices leads to better system architecture and fewer surprises during implementation. Prioritize the quality of your diagrams to support the quality of your software.