 Visual Paradigm Desktop |
  Visual Paradigm Online


Managing product requirements often feels like organizing a complex puzzle without the picture on the box. Teams accumulate stories, tasks, and features without a cohesive visual narrative. This fragmentation leads to gaps in logic, duplicated effort, and requirements that fail to address actual user needs. The solution lies not in adding more documentation, but in improving the structure of how requirements are visualized. Use Case Diagrams offer a proven method to bridge the gap between abstract goals and concrete implementation steps.
When applied correctly, these diagrams transform a chaotic backlog into a structured map of system behavior. They force stakeholders to define who interacts with the system and what value is delivered in each interaction. This clarity reduces ambiguity during development and ensures that every item in the backlog serves a specific purpose. Below, we explore the methodologies required to implement this approach effectively.
A Use Case Diagram is a static view of the system. It does not show how the system works internally, but rather what it does from the perspective of external entities. In the context of product management, this distinction is vital. A backlog item often describes a feature, but a use case describes a goal.
Consider the difference between a list of tasks and a model of intent. A task might say “Build a login button.” A use case says “Authenticate User.” The former is implementation; the latter is function. By focusing on the function first, teams can select the best technical approach later without losing sight of the user’s objective.
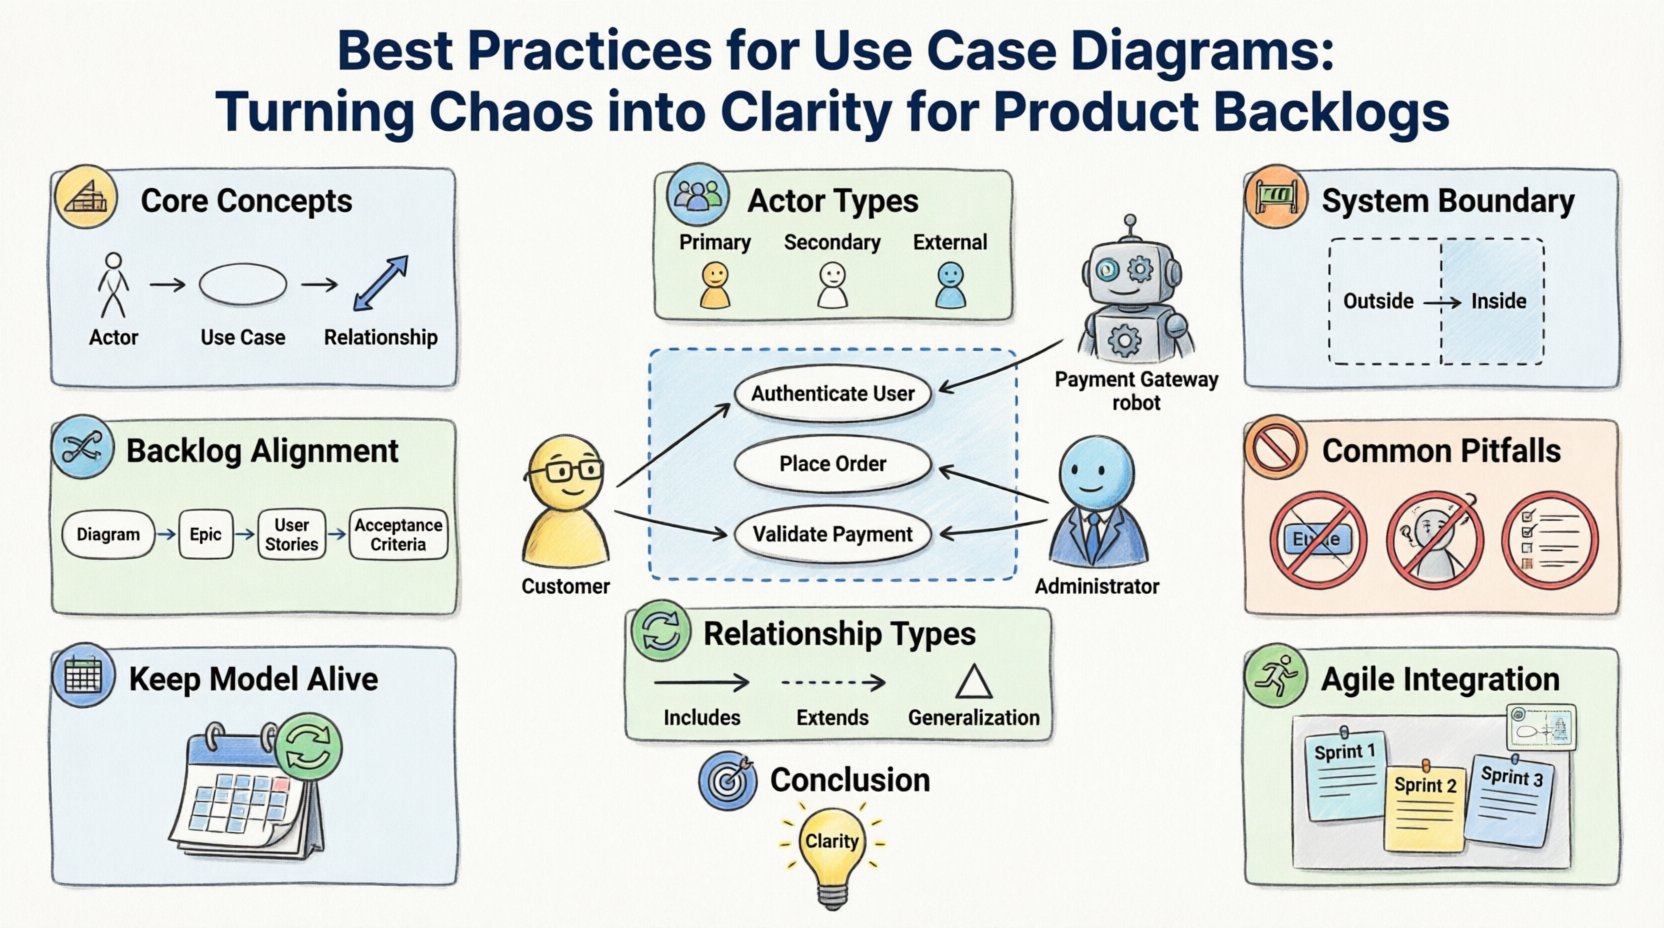
To integrate this into your workflow, you must understand the three primary components:
When these elements are clearly defined, the product backlog becomes a collection of confirmed interactions rather than a random assortment of ideas. This alignment ensures that the development effort is always directed toward delivering value.
The most common source of confusion in requirements modeling is the definition of an actor. An actor is not necessarily a person. It represents a role that interacts with the system. Misidentifying actors leads to scope creep or missed requirements.
When creating your diagram, categorize actors into two distinct groups: Human Actors and System Actors.
Defining these roles early prevents scope creep. If a feature request comes from a stakeholder who does not fit an existing actor role, it signals a need to review the system boundary. This review often reveals that the feature belongs to a different part of the architecture or requires a new actor entirely.
| Actor Category | Definition | Example |
|---|---|---|
| Primary Actor | Initiates the use case to achieve a goal | Customer placing an order |
| Secondary Actor | Provides support to the primary actor | Payment Processor verifying funds |
| External System | Automated interaction without human intervention | Email Server sending notifications |
By clearly distinguishing these categories, you can prioritize backlog items based on actor importance. Primary actors usually drive the core revenue or utility of the product, while secondary actors support the stability and compliance of the system.
One of the greatest challenges in product development is knowing what to build versus what to ignore. The system boundary in a Use Case Diagram serves as the visual contract for this scope. Everything inside the box is the system. Everything outside is the environment.
When modeling the boundary, focus on the interface between the user and the system. Do not include internal processes that do not have an external trigger. For example, a background process that runs every night at midnight might not appear as a standalone use case unless it produces an observable result for an actor.
Adhering to strict boundary rules offers several benefits:
It is important to remember that the diagram evolves. As the product matures, the boundary may shift. Features that were once internal may become exposed via an API. When this happens, the diagram must be updated to reflect the new actor. This dynamic nature ensures the backlog remains accurate over time.
The true power of this methodology emerges when the diagram is directly linked to the backlog. This connection ensures that every ticket in the management tool corresponds to a verified interaction model. Without this link, teams risk building features that look good in a diagram but fail to solve user problems.
To achieve this alignment, follow a structured process:
This hierarchy prevents the “feature factory” trap, where teams build features without understanding the underlying flow. When a user story is rejected during acceptance testing, you can trace it back to the diagram to see if the flow logic was flawed or if the implementation deviated.
Additionally, this approach helps in identifying technical debt. If a use case requires complex data handling that is not reflected in the diagram, it suggests a missing dependency. Addressing this in the backlog early prevents integration issues later in the release cycle.
As systems grow, diagrams can become cluttered. The key to maintaining clarity is the proper use of relationships between use cases. Three specific relationship types are essential for modeling complex behaviors:
Using these relationships correctly allows you to keep the diagram readable while capturing detailed logic. If you try to draw every single step as a separate use case, the diagram becomes unreadable. By grouping common behaviors, you maintain a high-level view that is still technically accurate.
This structure is particularly useful for agile teams. You can estimate the complexity of the main flow separately from the optional flows. This allows for better sprint planning. You might commit to the main flow in Sprint 1 and the extended flows in Sprint 2.
Even experienced practitioners fall into traps when modeling requirements. Recognizing these patterns early saves significant time during development. Below is a breakdown of common mistakes and their corrections.
| Pitfall | Why It Fails | Correction Strategy |
|---|---|---|
| UI Elements in Diagram | Focuses on screens rather than goals | Replace “Click Button” with “Initiate Action” |
| Too Many Actors | Confuses roles with individuals | Consolidate roles into functional categories |
| Missing Preconditions | Leads to undefined states | Document state requirements for each use case |
| Ignoring Error Flows | System works only in ideal scenarios | Model exception handling as extensions |
A specific error to watch for is mixing implementation details into the model. Avoid terms like “Database Query” or “API Call.” These are technical solutions, not user goals. The goal is “Retrieve Data.” The method is irrelevant to the diagram. Keeping the model abstract ensures that technical changes do not require a complete redesign of the requirements.
A diagram that is created once and never updated is useless. It becomes a static artifact that does not reflect the current state of the product. To maintain value, the diagram must be treated as a living document.
Integrate diagram reviews into your standard ceremonies. During backlog refinement sessions, check if the new stories fit the existing use case model. If a story introduces a new behavior that isn’t in the diagram, update the diagram first. This discipline ensures that the visual model remains the source of truth.
Regular audits are also necessary. Check for:
By keeping the model synchronized with the backlog, you create a feedback loop. The backlog informs the model, and the model constrains the backlog. This ensures that the product evolves logically rather than incrementally.
Agile methodologies prioritize working software over comprehensive documentation. Some teams view diagrams as contrary to this principle. However, a well-maintained Use Case Diagram supports agility by reducing the time spent clarifying requirements.
When developers start with a clear diagram, they spend less time asking questions about the “what” and more time on the “how.” This allows for faster sprints and higher quality code. The diagram acts as a shared mental model for the entire team, including designers, developers, and testers.
For Scrum teams, the diagram can serve as a reference during Sprint Planning. It helps the team understand the scope of the sprint relative to the broader system. If a sprint goal seems misaligned with the diagram, it is a signal to re-evaluate the priority of the backlog items.
Turning chaos into clarity requires discipline and a structured approach to modeling. Use Case Diagrams provide the framework needed to organize complex requirements into actionable backlog items. By focusing on actors, goals, and boundaries, teams can ensure that every development effort contributes to the overall system value.
The process is not about creating art; it is about creating understanding. When the diagram is accurate, the backlog is accurate. When the backlog is accurate, the product is successful. This alignment is the foundation of effective product management.
Implement these practices consistently. Start small with one module or feature. Expand the model as the product grows. The investment in modeling pays dividends in reduced rework, clearer communication, and a product that truly meets user needs.
Remember that the goal is not perfection. The goal is a model that is good enough to guide the team and flexible enough to change. By adhering to these best practices, you transform the diagram from a static drawing into a dynamic tool for product success.