 Visual Paradigm Desktop |
  Visual Paradigm Online


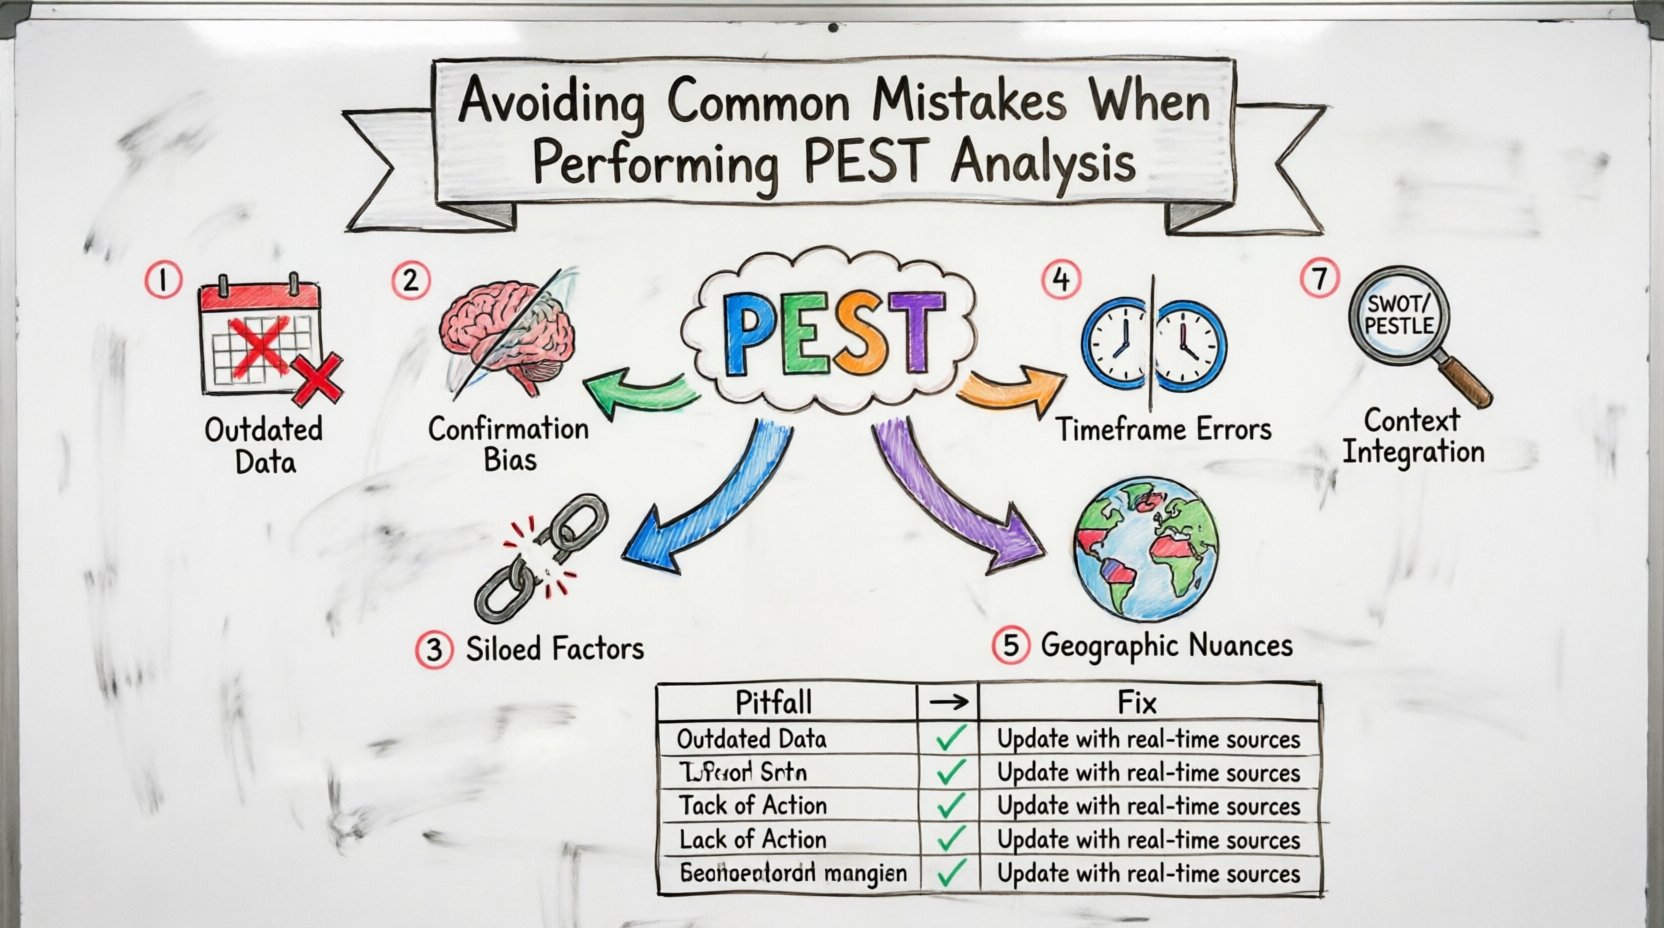
Strategic planning relies heavily on understanding the external environment. Among the various frameworks available, the PEST analysis remains a cornerstone for organizations seeking to navigate market dynamics. It stands for Political, Economic, Social, and Technological factors. However, a framework is only as good as its execution. Many teams perform this analysis superficially, leading to flawed strategies and missed opportunities.
This guide details the common pitfalls encountered during the PEST analysis process. By understanding these errors, you can ensure your strategic planning is grounded in reality rather than assumption. We will explore data integrity, cognitive biases, and the necessity of actionable insights.
Before diving into mistakes, it is essential to understand the core purpose of the tool. A PEST analysis is not a predictive crystal ball. It is a diagnostic tool. It helps identify external factors that could impact an organization’s operations. It forces leadership to look outward.
When done correctly, it highlights threats and opportunities. When done incorrectly, it creates a false sense of security. The goal is to inform decision-making, not to validate pre-existing beliefs.
The most critical error in any strategic analysis is the quality of input data. Many teams conduct a PEST analysis once a year and treat it as static. Markets shift rapidly. Regulatory landscapes change overnight. Economic indicators fluctuate.
Accuracy is paramount. If the data is flawed, the analysis is flawed. This leads to strategies based on false premises.
Confirmation bias occurs when analysts seek information that confirms their preconceived notions. This is common in organizational settings where leadership already has a vision and wants the data to support it.
When performing a PEST analysis, the instinct is often to find evidence that validates the current strategy. This negates the purpose of the exercise.
To avoid this, encourage diverse viewpoints. Include stakeholders from different departments. Sales teams see market shifts differently than engineering teams.
The acronym PEST suggests four distinct categories. However, in reality, these factors are deeply interconnected. Treating them as isolated silos leads to incomplete insights.
Strategic thinking requires seeing the web of causality. A change in one area ripples through the others. Failing to map these interdependencies results in a fragmented strategy.
Another frequent error involves the temporal scope of the analysis. Some teams look at immediate operational needs, while others look at long-term viability. A mismatch here causes friction.
Consider the timeframe requirements for different business decisions:
| Decision Type | Recommended Timeframe | Key PEST Focus |
|---|---|---|
| Short-term Marketing | 6 to 12 months | Current Economic trends, Social media shifts |
| Product Development | 2 to 5 years | Technological innovation, Regulatory changes |
| Market Entry Strategy | 5 to 10 years | Demographic shifts, Long-term Political stability |
Using a long-term horizon for short-term tactical decisions dilutes focus. Conversely, using a short-term view for infrastructure investment ignores future risks.
Global trends do not always apply uniformly across all regions. A common mistake is assuming that a factor affecting the headquarters market will affect all subsidiaries equally.
Localization is key. A global PEST analysis must be broken down into regional or national contexts for actionable strategy.
Analysis paralysis is a real risk. Teams can spend months gathering data without connecting it to action. A PEST analysis that results in a 50-page report with no clear next steps is a waste of resources.
The output must drive decision-making. For every factor identified, there should be a corresponding strategic response.
If the analysis does not change the plan, the exercise was redundant.
While PEST is robust, it is not exhaustive. Some industries require additional dimensions. For example, environmental regulations (E) or legal compliance (L) might be critical.
Furthermore, PEST is an external tool. It does not account for internal strengths or weaknesses. Using PEST in isolation without cross-referencing with a SWOT analysis (Strengths, Weaknesses, Opportunities, Threats) creates an imbalance.
To summarize the errors discussed, here is a comparison of common pitfalls and the recommended correct approaches.
| Pitfall | Correct Approach |
|---|---|
| Using old data | Validate data sources for currency and relevance. |
| Confirming bias | Invite external auditors or diverse internal stakeholders. |
| Siloed factors | Map interdependencies between Political, Economic, Social, and Technological elements. |
| Wrong timeframe | Align the analysis horizon with the specific strategic decision. |
| One-size-fits-all | Adapt the analysis for specific regional markets. |
| No action plan | Define specific strategic responses for every identified factor. |
To ensure a thorough analysis, each pillar requires specific attention. Here is a breakdown of what to look for within each category to avoid generic entries.
Political factors relate to government intervention and policy. Avoid listing generic statements like “government changes.” Be specific.
Economic factors determine the purchasing power of consumers and the cost of capital.
Social factors encompass demographics and cultural aspects.
Technological factors relate to innovation and automation.
Strategic planning is not a linear process. It is iterative. A PEST analysis should not be a one-off event. It requires regular review cycles.
Adaptability is a competitive advantage. Organizations that update their external analysis continuously are better positioned to pivot when necessary.
To ensure the analysis is comprehensive, incorporate feedback from various levels of the organization.
Excluding these voices limits the scope of the analysis. Their insights often reveal risks that high-level data misses.
Finally, the output of the PEST analysis must align with the organization’s mission and vision. If the analysis reveals a massive threat to the core business model, the organization must decide whether to adapt or exit.
Alignment ensures that the analysis serves the organization’s long-term health rather than just filling a compliance box.
To track the validity of the PEST analysis, establish metrics. Monitor the indicators you identified.
Without monitoring, the analysis becomes historical data rather than a strategic tool.
Navigating the complexities of the external environment requires rigor and discipline. Avoiding common mistakes in PEST analysis is about precision, honesty, and integration. By prioritizing data quality, recognizing bias, and linking insights to action, organizations can build robust strategies.
Remember that the goal is not perfection. It is clarity. A clear understanding of the external landscape allows for confident decision-making. Whether facing economic uncertainty or technological disruption, a well-executed analysis provides the compass needed to steer the organization forward.
Commit to continuous improvement. Review your frameworks. Challenge your assumptions. And always ground your strategy in the reality of the market environment.