 Visual Paradigm Desktop |
  Visual Paradigm Online


Implementing Agile methodologies promises faster delivery and better alignment with customer needs. However, many organizations stumble when trying to quantify that success. The temptation to track every available number is strong, but not all data represents progress. Some metrics, known as vanity metrics, offer a false sense of accomplishment while masking real inefficiencies. To truly improve, teams must focus on value-driven measurements that reflect reality rather than activity.
This guide explores the essential metrics that indicate genuine progress. We will distinguish between output and outcome, analyze the pitfalls of common misinterpretations, and provide a framework for selecting data that empowers rather than pressures your team. By focusing on these core indicators, organizations can foster sustainable growth and continuous improvement without compromising team well-being.
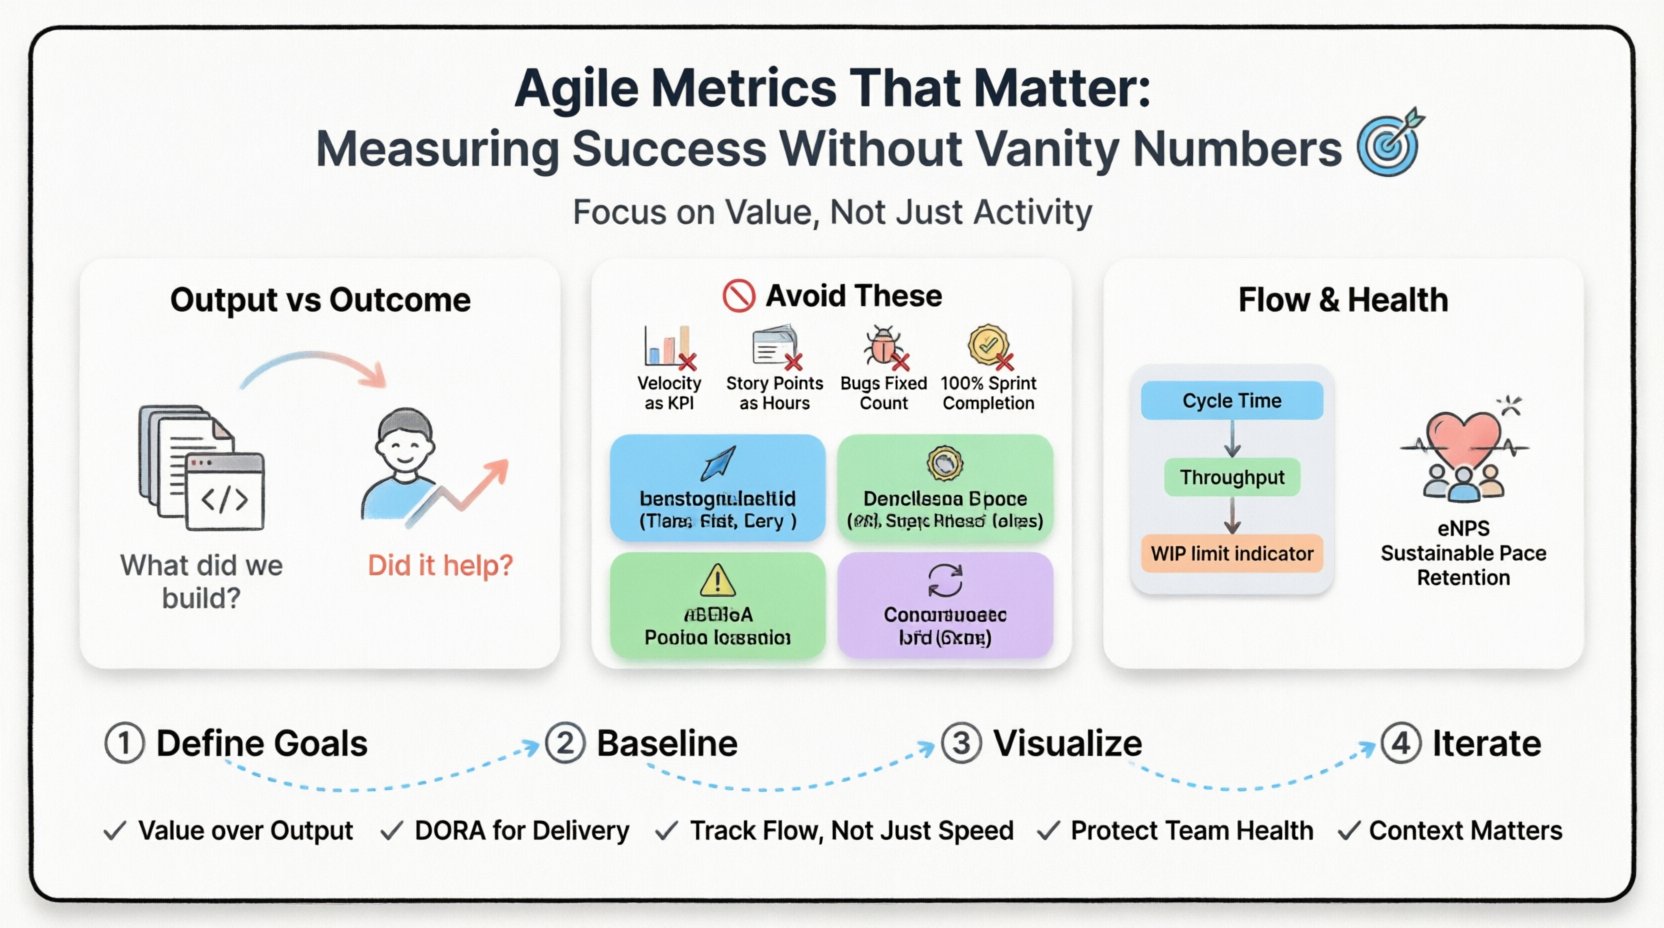
Understanding the difference between output and outcome is the foundation of effective measurement. Confusing these two concepts leads directly to vanity metrics. Output refers to the tangible work produced, such as code commits, story points completed, or tickets closed. Outcome refers to the value delivered to the customer or the business, such as user adoption, revenue generated, or problem resolution.
When teams optimize for output, they risk shipping features that no one uses. When they optimize for outcome, they align their efforts with actual user needs. Consider the following breakdown:
Agile frameworks encourage inspecting and adapting. This cycle requires accurate feedback. If the feedback loop is based on output alone, the adaptation may be misdirected. For instance, increasing velocity without improving quality or customer satisfaction often leads to technical debt accumulation. Therefore, a balanced scorecard is necessary to maintain a healthy development lifecycle.
Vanity metrics are numbers that look impressive but do not correlate with long-term success. They are often easy to measure but difficult to act upon. Relying on them can lead to gaming the system, where team members manipulate processes to improve numbers without delivering actual value. Below are common examples and why they often fail as primary indicators.
Velocity measures the amount of work a team completes in a sprint. While useful for internal planning and forecasting capacity, it becomes problematic when used as a performance benchmark. If management sets targets based on velocity, teams may:
Velocity is relative to the specific team. A team of senior developers will naturally have a higher velocity than a team of juniors. Comparing these numbers is invalid. Instead, use velocity to track consistency over time within the same team to predict future capacity.
Story points estimate effort, not time. However, teams often treat them as hours. This conversion creates a false sense of precision. Story points are relative units designed to normalize effort across different tasks. Using them to calculate cost per point or billable hours distorts the estimation process. They should remain a tool for planning, not accounting.
Tracking the count of bugs fixed can encourage teams to prioritize low-hanging fruit. A high number might indicate a chaotic environment rather than effective quality assurance. It is better to track the rate of defects escaping to production. This metric highlights the effectiveness of testing and development practices rather than the cleanup effort.
Completing 100% of a sprint’s scope is often a sign of poor planning or over-commitment. Teams that consistently hit 100% may be padding their estimates or avoiding difficult tasks. A completion rate between 80% and 90% often indicates a healthy balance of commitment and realistic planning.
To measure success without vanity, many high-performing teams adopt the DORA metrics (DevOps Research and Assessment). These four key performance indicators focus on the delivery and stability of software. They provide a standardized way to benchmark performance against industry standards.
| Metric | Definition | Why It Matters |
|---|---|---|
| Deployment Frequency | How often code is successfully deployed to production. | Indicates agility and the ability to release value quickly. |
| Lead Time for Changes | Time from code commit to code running in production. | Measures efficiency in the development pipeline. |
| Change Failure Rate | Percentage of deployments causing a failure in production. | Highlights quality and stability of the release process. |
| Time to Restore Service | Time taken to recover from a failure in production. | Shows resilience and incident response capability. |
High-performing teams typically deploy frequently with low failure rates and fast recovery times. These metrics encourage a culture of automation and continuous improvement. When teams focus on reducing lead time, they naturally improve flow and reduce waste. When they focus on failure rates, they prioritize quality testing and monitoring.
It is important to note that these metrics are comparative. They are best used to track trends over time rather than to judge individual performance. The goal is to move from a “low performer” status to a “high performer” status by improving the underlying processes.
Beyond deployment, the flow of work through the system is critical. Lean principles suggest that reducing work-in-progress (WIP) improves throughput. Flow metrics help visualize where bottlenecks occur and how long work items linger in the system.
Cycle time measures the duration from when work begins on a task until it is ready for release. Short cycle times correlate with lower risk and faster feedback. If cycle time increases, it often signals bottlenecks in testing, approval, or development. Teams should aim to reduce cycle time variance, ensuring predictability in delivery.
Throughput counts the number of items completed in a specific timeframe. Unlike velocity, throughput does not rely on estimation. It is a raw count of finished work. Monitoring throughput helps teams understand their capacity. If throughput drops, it is a signal to investigate impediments rather than to increase pressure on the team.
High WIP limits context switching and slows down completion. Limiting WIP forces teams to finish current tasks before starting new ones. This practice reduces multitasking and improves focus. Visualizing WIP limits on a Kanban board helps teams self-regulate and maintain a sustainable pace.
Metrics that focus solely on delivery ignore the human element. Burnout is a significant risk in high-pressure environments. Sustainable Agile requires a healthy team. Ignoring well-being metrics can lead to turnover, which destroys institutional knowledge and slows delivery.
Regularly surveying team members about their satisfaction and willingness to recommend the team is vital. A declining score often precedes performance issues. It provides early warning signs of morale problems, excessive workload, or lack of autonomy.
Monitor overtime hours and after-hours communication. Consistent overtime is a red flag, not a badge of honor. It suggests understaffing or inefficient processes. Teams that work sustainable hours consistently outperform those that burn out in sprints.
High turnover disrupts flow and requires constant onboarding. Tracking retention rates helps identify if the organizational culture supports long-term growth. If key personnel leave frequently, investigate the root causes, such as lack of growth opportunities or toxic management practices.
Adopting new metrics requires a thoughtful approach. Introducing too many measurements at once creates noise and confusion. Teams should follow a structured path to ensure metrics support improvement rather than dictate it.
Start by asking what you want to improve. Is it speed? Quality? Stability? Do not select metrics simply because they are industry standards. Select them based on current pain points. If quality is low, focus on change failure rate. If delivery is slow, focus on lead time.
Measure the current state before making changes. This baseline allows you to track progress objectively. Without a baseline, it is impossible to know if improvements are real or just noise.
Make metrics visible to the team. Use dashboards or boards to display data. Review these metrics during retrospectives. Discuss trends, not just numbers. Ask why a metric changed rather than who is responsible.
Metrics are not static. As processes improve, the metrics may need to change. If a metric stops providing insight, retire it. Continuously evaluate the usefulness of your data sources.
Even with the right metrics, implementation can go wrong. Awareness of common pitfalls helps avoid them.
The goal of measurement is not control, but insight. A healthy measurement culture treats data as a tool for learning. It encourages transparency and psychological safety. When teams feel safe discussing failures, they can use metrics to find root causes rather than assigning blame.
Leadership plays a crucial role in this culture. Leaders must model the behavior of using data for improvement. They should ask questions about the “why” behind the numbers. They should celebrate improvements in process, not just output.
While delivery metrics are immediate, long-term value tracking ensures the product remains relevant. This involves looking beyond the sprint or release cycle.
These metrics connect development work to business outcomes. They ensure that the team is building the right things, not just building things right. By integrating these business metrics with delivery metrics, organizations gain a holistic view of success.
To summarize, effective Agile measurement requires a shift from vanity to value. Focus on the following principles:
By adhering to these guidelines, teams can create a feedback loop that drives genuine improvement. The data should serve the team, not the other way around. When metrics are used correctly, they illuminate the path to better software and a healthier organization.
Remember that metrics are a means to an end. The end is a sustainable, high-quality delivery process that delivers value to users. Keep the focus there, and the numbers will naturally reflect that success.