 Visual Paradigm Desktop |
  Visual Paradigm Online


Agile methodology promises flexibility, responsiveness, and continuous improvement. However, the reality often includes setbacks. A failed sprint is not an anomaly; it is a data point. Understanding how a team navigates failure determines long-term success more than celebrating perfect cycles.
This article examines a specific scenario where a development team missed their sprint goals entirely. We will explore the technical and human factors involved, the retrospective process used to diagnose the issue, and the concrete steps taken to restore velocity and quality.
To understand the failure, we must first understand the structure. The organization operates with a cross-functional team model. The group consists of five developers, one product owner, and a dedicated tester. Work is organized into two-week cycles.
The team utilized a physical and digital tracking board to manage flow. Stories were moved from Backlog to In Progress and finally to Done. The goal was consistent delivery of value without compromising code quality.
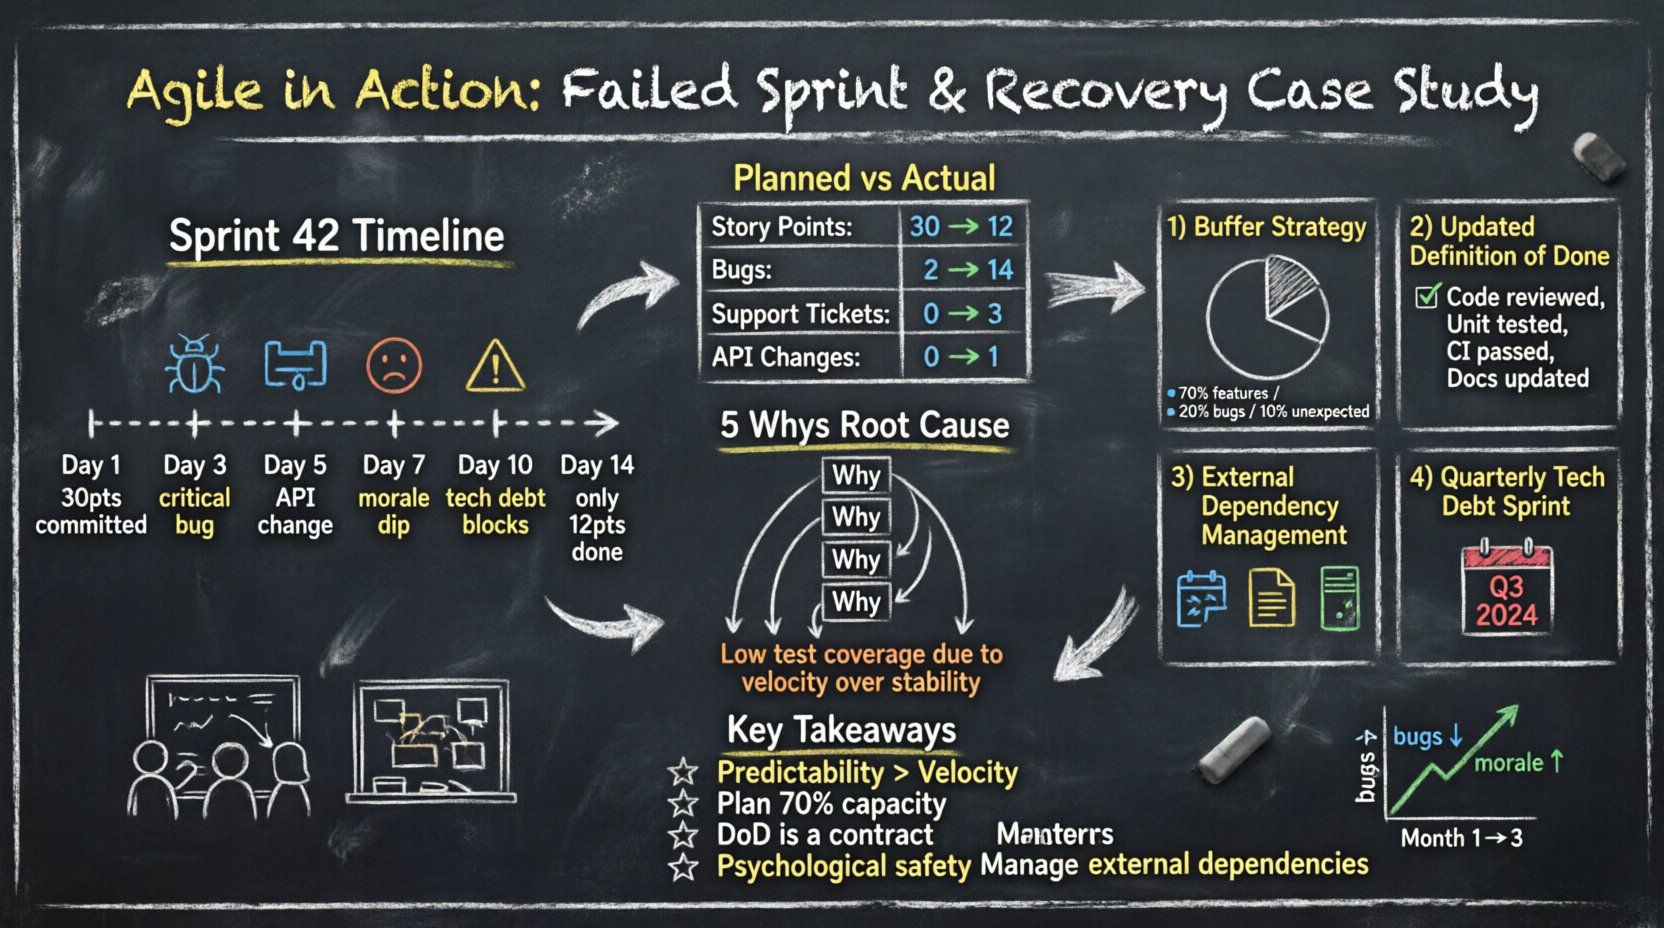
Sprint 42 began with high momentum. The team pulled 30 story points from the backlog. By day three, the pace seemed steady. By day five, friction appeared. By day ten, the team realized they would not complete the committed work.
The failure was not due to a single catastrophic event. It was a compounding series of issues that eroded capacity.
Numbers tell a clearer story than feelings. The following table illustrates the variance between planned effort and actual delivery.
| Category | Planned | Actual | Variance |
|---|---|---|---|
| Story Points Completed | 30 | 12 | -18 |
| Bugs Found (During Sprint) | 2 | 14 | +12 |
| Support Tickets Handled | 0 | 3 | +3 |
| External Dependency Changes | 0 | 1 | +1 |
This data reveals a significant diversion of resources. What started as development work turned into maintenance and crisis management.
Blaming individuals does not solve systemic problems. The team conducted a blameless root cause analysis to identify the underlying issues.
To dig deeper, the team applied the 5 Whys method to the issue of missed deadlines.
The core issue was not planning accuracy; it was sustainable engineering practices.
A retrospective is the engine of agile improvement. However, a failed sprint requires a specific type of retrospective. Standard formats often feel like a check-box exercise. This session required psychological safety and deep inquiry.
Before the meeting, the product owner collected data. The team was asked to reflect individually on what went well and what did not. This ensured quiet team members had time to formulate thoughts.
The team discussed the concept of capacity planning. They realized they had committed 100% of their time to new features. There was zero slack for the inevitable interruptions that occur in live environments.
They also addressed the Definition of Done. Currently, “Done” meant “Code Written.” It did not include “Code Reviewed” or “Tests Written.” This discrepancy caused a bottleneck at the end of the sprint.
Knowing the problem is only half the battle. The recovery plan required changes to workflow, expectations, and technical standards.
The team stopped committing 100% of their available hours. They adopted a buffer strategy.
This change reduced the pressure to deliver perfect numbers and allowed for realistic handling of interruptions.
The team updated their DoD checklist. A story could not move to Done without meeting these criteria:
This prevented technical debt from accumulating silently. It ensured that what was delivered was truly usable.
Communication channels with external vendors were formalized. The team now requires:
The team agreed to dedicate one sprint every quarter specifically to technical debt reduction. This prevents the compounding interest effect of bad code. It signals to stakeholders that stability is a feature, not an afterthought.
Changes were implemented immediately in Sprint 43. The recovery was not instant, but the trajectory shifted.
The team did not aim to return to the old velocity of 30 points. They aimed for predictability. It is better to commit to less and deliver consistently than to overcommit and fail.
To ensure the recovery stuck, the team tracked specific metrics over the next three months.
| Week | Sprint Goal Met | Bug Count | Team Morale (1-5) |
|---|---|---|---|
| Month 1 | Yes | 12 | 3 |
| Month 2 | Yes | 8 | 4 |
| Month 3 | Yes | 5 | 5 |
The data shows a clear correlation between process changes and team health. Fewer bugs led to less stress, which improved morale.
Failure is a teacher. Here are the lessons learned from this case study that apply to any agile environment.
Speed without stability is an illusion. Teams should prioritize consistent delivery over raw output. Stakeholders trust teams that hit their promises, even if those promises are smaller.
Always plan for the unexpected. If you have 100 hours available, plan for 70 hours of work. The remaining time absorbs the inevitable friction of software development.
DoD is not a suggestion. It is a contract between the team and the product owner. If a story does not meet the DoD, it is not ready for release.
When things go wrong, the team must feel safe to speak up. If members fear punishment, they will hide problems until they become crises.
Software does not exist in a vacuum. Dependencies on third-party services must be managed with the same rigor as internal code.
Many teams try to fix failure by working harder. This is a common mistake. The following actions should be avoided during a recovery period.
The goal of agile is not just to ship code, but to build a system that can ship code indefinitely. Sustainable pace is the foundation of this system.
After the recovery, the team established a continuous improvement rhythm. Every two weeks, they review not just the sprint, but the health of the workflow. They ask questions like:
This ongoing scrutiny prevents small issues from becoming large failures again.
Transparency with stakeholders is crucial. When a sprint fails, communicate early. Explain the impact, the cause, and the plan. This builds trust.
Stakeholders often view a failed sprint as incompetence. When explained as a data point for improvement, it becomes a demonstration of professional maturity. They prefer a team that admits a problem and fixes it over a team that hides the problem.
Failures are normal. A 10% miss rate is often acceptable depending on the domain. Consistent high miss rates indicate a systemic planning issue.
Usually, no. Stopping a sprint wastes the time already spent. It is better to finish what can be finished and reset for the next cycle.
Yes, if your velocity is artificially inflated by overcommitment. Lowering it to match reality improves accuracy and predictability.
Short-term fixes are possible, but long-term recovery requires process change. Otherwise, the failure will repeat.
Agile is a journey of adaptation. A failed sprint is not the end of the road; it is a signpost pointing toward better practices. By analyzing the failure deeply and implementing structural changes, teams can emerge stronger and more resilient.