 Visual Paradigm Desktop |
  Visual Paradigm Online


Imagine transforming your coffee shop’s strategic goals into a clear, visual roadmap with just a few clicks. The AI-Powered KPI Performance Diagram Builder from Visual Paradigm makes this a reality. This powerful tool leverages artificial intelligence to instantly generate a comprehensive performance framework, connecting your core initiatives to the metrics and KPIs that truly matter. Visual Paradigm’s KPI Performance Diagram Builder is more than just a diagramming tool; it’s a strategic intelligence engine designed to turn complex data into actionable insights. With its intuitive drag-and-drop interface and AI-driven features, it empowers business leaders, project managers, and consultants to build, analyze, and communicate their performance strategy with unprecedented clarity and speed.
At the heart of this tool is the ability to create a dynamic, interactive diagram that maps the entire performance ecosystem. The first step is simple: input a domain name, like “Coffee Shop,” and let the AI do the heavy lifting. The result? A beautifully organized diagram that visually connects your strategic initiatives, the metrics that track their progress, and the high-level KPIs that measure overall business success. This visual representation is not just a pretty picture; it’s a living document that provides strategic clarity, fosters accountability, and enhances communication across your entire organization.
Let’s take a closer look at how this innovative tool functions, using the coffee shop example shown in Image 1. The process begins with the AI-powered generation. You simply enter your project domain, and the AI instantly populates the canvas with a pre-built structure. This initial diagram, as seen in the image, includes initiatives like “New Recipe Testing” and “Social Media Ads,” along with their corresponding metrics such as “Customer Repeat Visits” and “New Customer Count.” The AI intelligently connects these elements, showing the positive influence of each initiative on the relevant metrics and, ultimately, on the key performance indicators like “Customer Happiness Rate” and “Monthly Profit.”
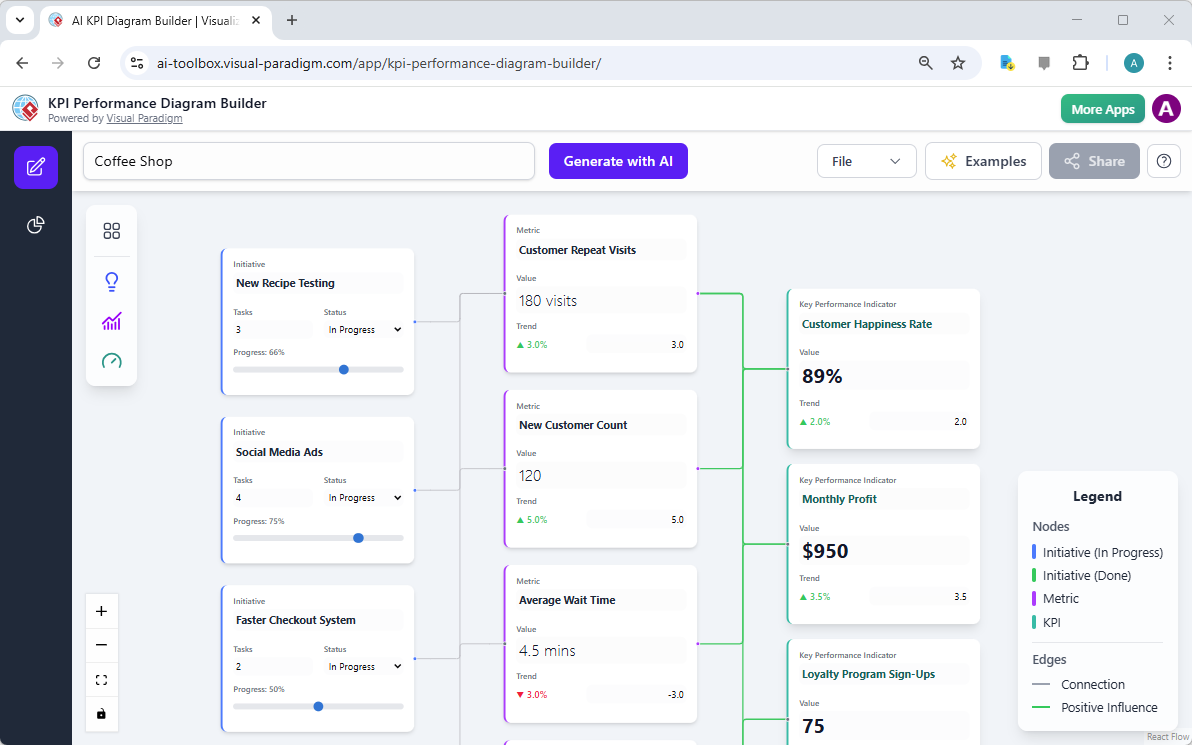
Once the AI has generated the initial framework, the real power of the AI-Powered KPI Performance Diagram Builder unfolds. The interactive canvas, powered by React Flow, allows you to freely drag, drop, and rearrange nodes. You can easily add new initiatives, metrics, or KPIs, or connect them with arrows to show relationships. The ability to double-click on any node to edit its details—such as progress, status, or value—gives you complete control over the diagram’s content. This is where the tool transforms from a static generator into a dynamic, living strategy map.
Creating a diagram is just the beginning. The true value lies in the AI-driven insights it can generate. By switching to the “AI Insights” view, you can transform your visual map into a suite of powerful analytical reports. For the coffee shop example, you could generate an executive summary to get a high-level overview, a performance analysis to dive into the data, or a risk assessment to identify potential vulnerabilities in your strategy. These reports are not generic; they are generated based on the specific relationships and data within your unique diagram, providing data-driven decision-making support.
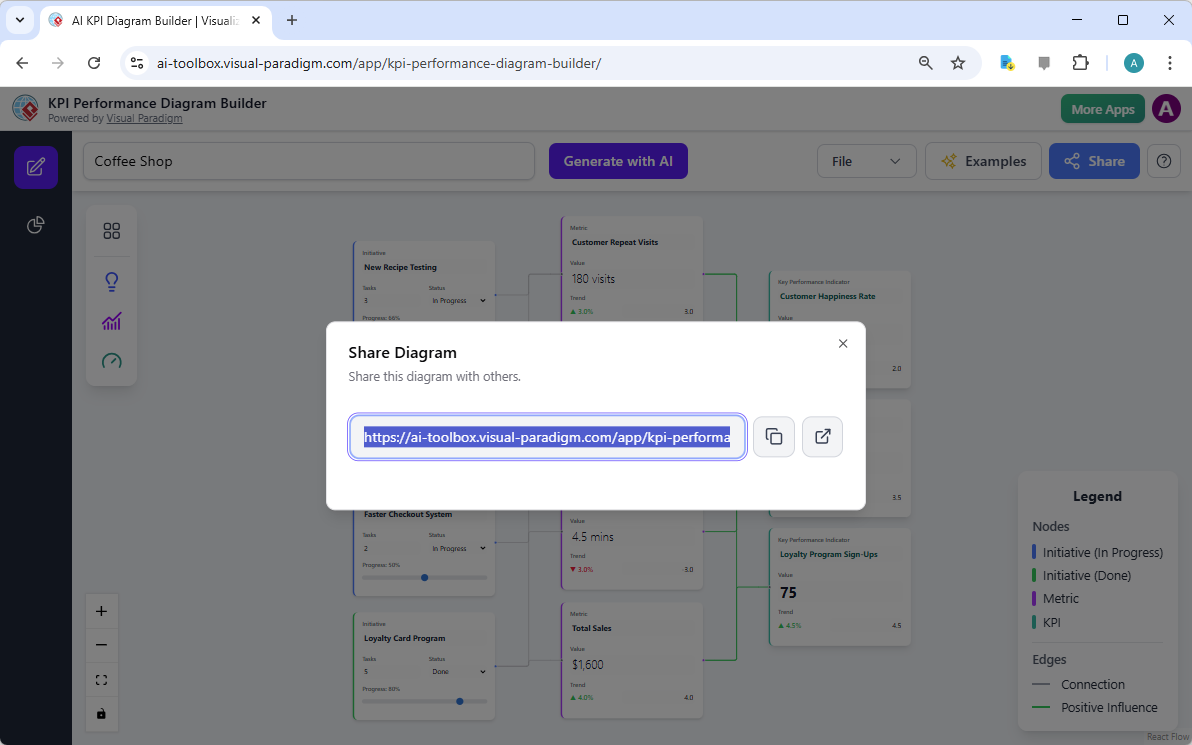
Another key feature, demonstrated in the image below, is the ability to share your work seamlessly. After saving your project to the cloud, you can generate a unique, read-only URL to share your KPI diagram with stakeholders, clients, or team members. This eliminates the need for complex file transfers and ensures everyone is looking at the same, up-to-date version of your strategic framework. The sharing interface is clean and intuitive, making it easy to collaborate and get feedback.
By integrating the AI-Powered KPI Performance Diagram Builder into your workflow, you gain a significant competitive advantage. Here are the core benefits:
Strategic Clarity & Alignment: Visually connect every initiative to its impact on key metrics and KPIs, ensuring everyone in the organization understands how their work contributes to the bigger picture.
Accelerated Framework Design: Overcome the “blank canvas” problem. Let AI generate a foundational diagram, saving you hours of brainstorming and setup time.
Data-Driven Decision Making: Leverage AI-generated insights to analyze performance, identify risks, and make informed strategic recommendations based on your actual data.
Enhanced Accountability: Clearly define the relationships between initiatives, metrics, and KPIs, fostering a culture of ownership and responsibility.
Professional & Shareable Output: Easily export your diagrams as high-quality PNG images for presentations or documentation, or share them via a simple link.
Don’t let your strategic goals remain abstract. The AI-Powered KPI Performance Diagram Builder from Visual Paradigm provides the perfect solution to visualize, analyze, and communicate your performance strategy. Whether you’re a business strategist, a project manager, or a consultant, this tool can revolutionize how you plan and execute your initiatives. It’s a powerful, intuitive platform that combines the best of AI and visual design to make complex performance frameworks simple and accessible.
Ready to see how it works? Try the AI-Powered KPI Performance Diagram Builder now and start building your strategic roadmap in minutes. Unlock the power of visual intelligence and drive your business to new heights.
AI KPI Performance Diagram Builder | Visualize Your Strategy: Use our AI-powered tool to create and visualize KPI Performance Diagrams. Map the relationship between strategic initiatives, metrics, and key business goals for clarity and data-driven insights.
AI-Powered KPI Performance Diagram Builder – Visual Paradigm AI: Generate executive summaries, performance breakdowns, strategic recommendations, and risk analyses. Turn your diagram into a powerful analytical report with a single click. …
AI KPI Diagram Builder | Visualize & Analyze Business Performance with AI: Map out initiatives, metrics, and KPIs with AI. Build dynamic diagrams, uncover insights, and generate executive summaries that drive smarter strategic …
AI KPI Diagram Generation Tool – Visual Paradigm Product Updates: Effortlessly generate, visualize, and analyze your business strategy with Visual Paradigm’s new AI KPI Performance Diagram Builder.
Intelligent BPM and Analysis Suite | AI Process Mapping Tool – Visual Paradigm: Visual Paradigm’s AI-powered suite helps document, visualize, and analyze business processes with stakeholder diagrams and reports effectively.
KPI Mapping | Project Process Map Template: Eye-catching Project Process Map template: KPI Mapping. Great starting point for your next campaign. Its designer-crafted, professionally designed and helps you stand out.
KPI Mapping Template: Fully customizable KPI mapping template that helps you define your own KPI mapping. Try Visual Paradigm Online’s visual process map designer. Sign up today. Try it free.