 Visual Paradigm Desktop |
  Visual Paradigm Online


A public service system like tax filing needs structure. Without it, the logic gets tangled, and the team spends time clarifying what each part does. That’s where AI-powered modeling software steps in.
Instead of manually drawing every package or guessing which components belong together, a user can simply describe the system. The AI interprets the description and generates a clear, professional package diagram—right in the chat.
This isn’t just about drawing boxes. It’s about organizing complex systems into manageable, understandable parts. The result is a visual map that shows which components are core, which support them, and how they connect.
The user was part of a government IT team tasked with modernizing the tax filing process. The system needed to be transparent, scalable, and secure. They didn’t have a team of UML experts, so they turned to an AI-powered modeling tool to build the foundation.
Their goal was simple: show the structure of the tax filing system so stakeholders could see how data flows and which parts are essential.
They started with a basic request:
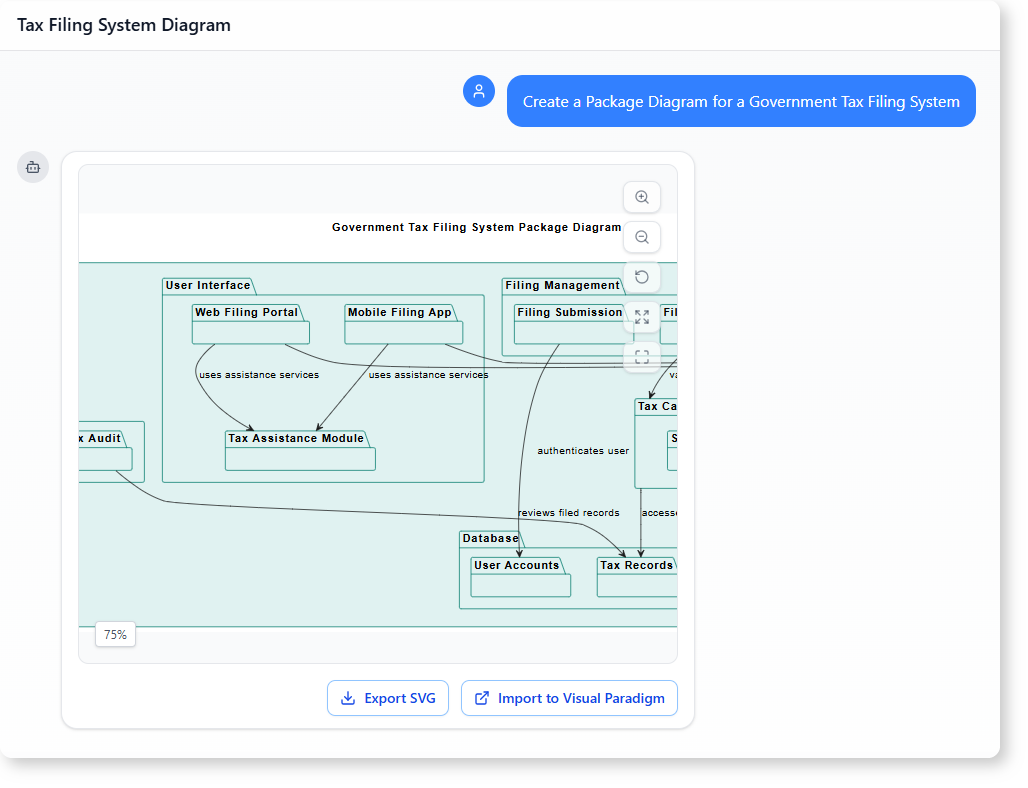
“Create a Package Diagram for a Government Tax Filing System.”
The AI responded by generating a full package diagram with clearly defined packages, organized from top to bottom. It showed the main system and its components—like tax calculation, filing, database, and user interface—each built into logical groupings.
After reviewing the structure, they asked a follow-up:
“Generate a report discussing which packages are core and which are supporting modules.”
The AI then analyzed the diagram and provided a breakdown, highlighting the primary modules that drive the system’s function and the ones that assist them.
The AI didn’t just draw the diagram—it explained the system’s architecture.
The core packages are the ones that perform the main functions:
These are the pillars of the system. Without them, the tax filing process wouldn’t work.
Supporting packages help run the system smoothly:
The AI pointed out that the user interface and tax assistance are not core to calculation but are essential for usability. This distinction helps teams prioritize development and testing.
In government systems, clarity is non-negotiable. Teams need to understand not just what a system does, but how it’s built.
With traditional methods, someone might spend hours sketching a diagram. The result could be incomplete or misaligned. With AI-powered modeling software, the same user gets a structured, accurate, and immediately usable visualization.
The AI doesn’t just generate a diagram. It understands the context and classifies components based on their role. That means the output isn’t just visual—it’s functional, informative, and directly tied to real-world operations.
This is not just a tool for developers. It helps project managers, auditors, and policymakers understand the system at a glance.
It transforms natural language into a structured system diagram. Instead of relying on templates or assumptions, users describe the system, and the AI builds the architecture with accurate relationships and logical groupings.
Yes. Based on the system’s function, the AI identifies which parts are essential to operation and which support usability or data access. This helps prioritize development and risk assessment.
Absolutely. The diagram uses clear labels and simple relationships. Combined with a short report, it turns complex technical details into something anyone can understand.
It doesn’t require prior knowledge of modeling syntax or templates. Users describe the system in plain language, and the AI builds the diagram and explains its structure—making it accessible to anyone from a project manager to a policy advisor.
Ready to map out your system’s interactions? Give our AI-powered modeling software a try at Visual Paradigm’s AI Chatbot today!