 Visual Paradigm Desktop |
  Visual Paradigm Online


In the realm of embedded systems and Internet of Things (IoT) design, reliable control logic is paramount. One of the most effective ways to model the dynamic, event-driven behavior of devices like smart thermostats is throughUML State Machine Diagrams (often referred to simply as State Diagrams). These diagrams excel at capturing the reactive nature of hardware that must transition between distinct modes of operation based on sensor inputs.
This case study provides a deep dive into modeling a smart thermostat. We will explore the real-world context, deconstruct a practical diagram, outline a step-by-step design methodology, and demonstrate how modern AI tools in Visual Paradigm can accelerate the creation process.
Modern thermostats, such as those from Nest, Ecobee, or Honeywell, are far more complex than simple on/off switches. They must handle sophisticated requirements to ensure user comfort and hardware longevity. A robust controller needs to:
A UML State Machine Diagram captures this state-dependent behavior far better than sequence or activity diagrams. By explicitly defining states and valid transitions, engineers can prevent logic bugs, provide clear documentation for firmware developers, and facilitate formal verification. In advanced workflows, these models can even support code generation.
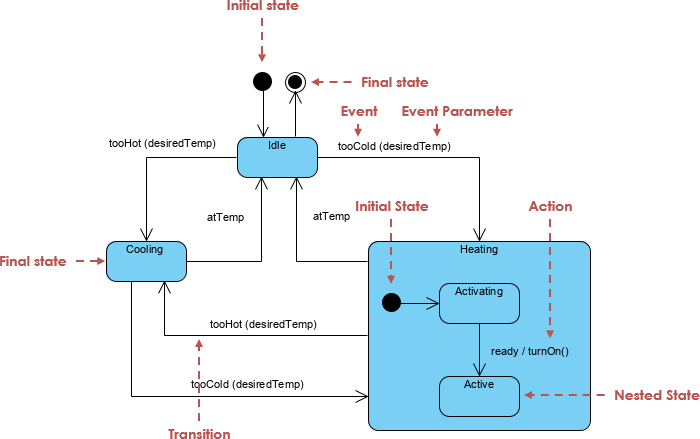
A standard smart thermostat model relies on a clear hierarchy of states. Below is a detailed breakdown of how to interpret such a diagram, moving from the top-level structure to the internal logic of composite states.
At the highest level, the controller typically revolves around three primary states:
The movement between these states is governed by guards—conditional logic based on sensor data.
[tooHot(desiredTemp)] is met.[tooCold(desiredTemp)] is met.[atTemp]).Unlike cooling, which is often immediate, heating systems frequently require a preparation phase. This is modeled using a Composite State, which hides complexity from the top-level view while maintaining precision.
ready / turnOn().Building a professional state machine diagram requires a structured approach. Follow these steps to replicate the thermostat model:
[tooHot] for conditions and actions like /turnOn() for resulting behaviors.To ensure your state machine is both readable and technically accurate, adhere to the following professional guidelines:
| Category | Guideline | Why it Matters |
|---|---|---|
| Naming Conventions | Use present participles for states (e.g., Heating, Cooling). | Reflects the ongoing nature of the state in the real world. |
| Guards vs. Events | Place temperature logic in guards (e.g., [temp > 25]), not event names. |
Events represent raw sensor inputs; guards represent the business logic filtering those inputs. |
| Composite States | Encapsulate startup sequences inside composite states. | Keeps the top-level diagram clean and readable for stakeholders. |
| History States | Use a shallow history pseudostate within Heating if power interruptions are common. | Allows the system to resume the Active state immediately after a brief glitch, skipping the warm-up. |
| Actions Location | Prioritize entry/exit actions over transition actions. | Ensures code reusability when multiple transitions lead to the same state. |
| Hysteresis | Document the gap in thresholds (e.g., +1.5° vs -1.5°). | Crucial for preventing hardware oscillation. |
As of 2026, tools like Visual Paradigm have revolutionized the diagramming process with AI-powered features. The days of manually dragging and dropping every box and line are fading, replaced by text-to-diagram generation and conversational refinement.
For a rapid first draft, users can utilize the AI Diagram Generator. By describing the system in natural language, the AI constructs a structurally sound diagram in seconds.
Example Prompt:
“Create a UML State Machine Diagram for a smart thermostat controller with hysteresis. Top-level states: Idle, Cooling, Heating (composite). From Idle, transition to Cooling if too hot, or Heating if too cold. Inside Heating, include Activating and Active sub-states. Add guards for temperature thresholds.”
Once the initial diagram is generated, the AI Chatbot allows for iterative improvements without navigating complex menus. You can issue commands such as:
startCompressor() to the Cooling state.”tooHot guard to [currentTemp > desiredTemp + 1.5].”This workflow significantly reduces the time from concept to validation, allowing engineers to focus on logic rather than layout mechanics. Reports suggest that creating a fully refined diagram, which previously took up to an hour, can now be achieved in under 10 minutes.
The smart thermostat serves as a textbook example of why UML State Machines remain essential. They bridge the gap between abstract requirements and concrete firmware implementation, capturing reactive logic that simple flowcharts miss. With the advent of AI-assisted modeling in tools like Visual Paradigm, the barrier to entry has been lowered, enabling faster, more accurate, and better-documented system design.
The following articles and resources provide detailed information on using AI-powered tools to create, refine, and master UML state machine diagrams within the Visual Paradigm platform:
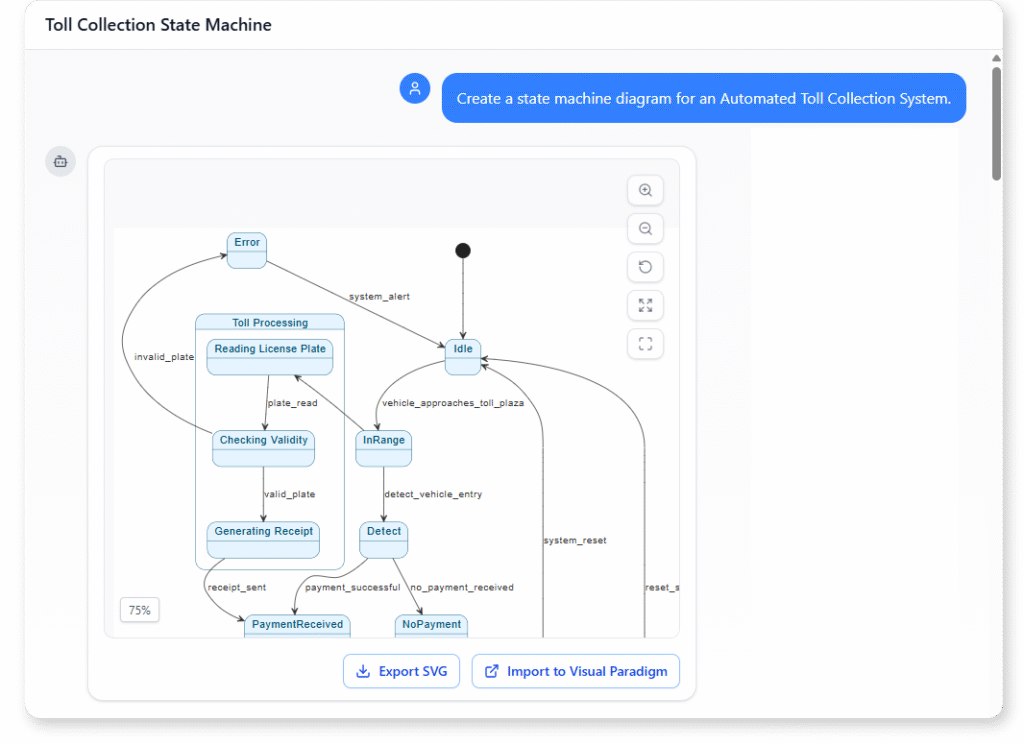
Mastering State Diagrams with Visual Paradigm AI: A Guide for Automated Toll Systems: This guide demonstrates how to utilize AI-enhanced state diagrams to model and automate the complex behaviors of an automated toll system.
AI-Powered UML Chatbot State Diagrams: This article explores the ways artificial intelligence improves the creation and interpretation of UML state diagrams specifically for the development of chatbot systems.
Definitive Guide to UML State Machine Diagrams with AI: This comprehensive resource provides a detailed guide on using AI-enhanced modeling tools to visualize object behavior through UML state machine diagrams.
Interactive State Machine Diagram Tool: This web-based platform allows teams to create and edit state machine diagrams in real time with generative AI support for faster software engineering workflows.
Visual Paradigm – UML State Machine Diagram Tool: This interactive online tool provides a dedicated interface for creating, editing, and exporting detailed UML state machine diagrams for modern software design.
AI Chatbot for Diagram and Model Generation: This AI-powered assistant enables users to generate various models, including state diagrams, through natural language interaction and simple text prompts.