 Visual Paradigm Desktop |
  Visual Paradigm Online


UML (Unified Modeling Language) Activity Diagrams are a type of behavioral diagram used to represent the dynamic aspects of a system. They focus on the flow of control and data between activities, illustrating workflows, processes, or algorithms in a visual manner. Similar to flowcharts, activity diagrams emphasize the sequence of actions, decisions, and parallel executions within a system or business process.
Activity diagrams are part of the UML 2.5 standard and are particularly useful for modeling procedural logic, business processes, and system behaviors without delving into the internal structure of objects (which is handled by other UML diagrams like class diagrams). They help stakeholders understand how a system responds to inputs, handles conditions, and produces outputs.
Activity diagrams consist of several core elements that define the structure and flow. Below is a breakdown of the most important concepts:
Activities and Actions:
An activity is a high-level behavior or process that can be broken down into smaller steps.
An action is an atomic, executable step within an activity, represented by a rounded rectangle. Actions can include operations like “Send Email” or “Validate Input.”
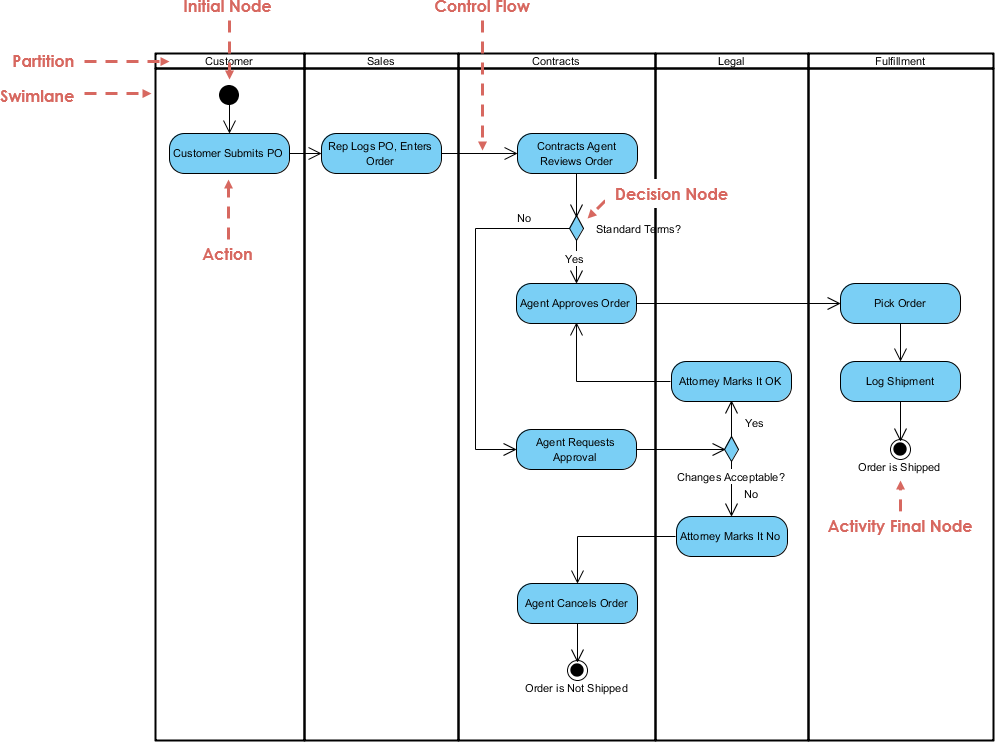
Control Flows:
These are directed arrows (solid lines) that show the sequence of execution from one action to another. They indicate the path the process takes.
Initial and Final Nodes:
The initial node (a filled black circle) marks the starting point of the activity.
The activity final node (a circle with a filled black dot inside) indicates the end of the entire activity.
There’s also a flow final node (a circle with an X) that terminates a specific flow without ending the whole activity.
Decision and Merge Nodes:
A decision node (diamond shape) represents a branching point where the flow diverges based on conditions (e.g., [yes] or [no] guards on outgoing flows).
A merge node (also diamond) brings multiple flows back together without conditions.
Fork and Join Nodes:
A fork node (thick horizontal or vertical bar) splits a single flow into multiple parallel flows, allowing concurrent activities.
A join node (similar bar) synchronizes parallel flows back into one, ensuring all branches complete before proceeding.
Object Flows:
Dashed arrows that represent the flow of data or objects between actions, pins, or nodes. Pins (small squares on actions) can show inputs/outputs.
Partitions (Swimlanes):
Vertical or horizontal lanes that group activities by responsibility, such as roles (e.g., User, System) or departments. This helps clarify who or what performs each action.
Exceptions and Interruptions:
Interruptible regions (dashed rounded rectangles) define areas where the flow can be interrupted by events.
Expansion regions handle repetitive or concurrent processing of collections.
Tokens:
Conceptual “tokens” flow through the diagram, representing control or data. This token-based semantics ensures proper execution order, especially in parallel scenarios.
These elements allow activity diagrams to model complex behaviors while remaining intuitive.
To illustrate these concepts, we’ll use PlantUML, a text-based tool for generating UML diagrams. PlantUML allows you to describe diagrams in a simple syntax and render them as images (e.g., via online PlantUML servers or integrated tools). Below are examples with PlantUML code snippets. You can copy-paste these into a PlantUML renderer to visualize them.
This example shows a basic workflow for processing an online order, including decisions and sequential actions.
PlantUML Code:
@startuml
start
:Receive Order;
:Validate Payment;
if (Payment Valid?) then (yes)
  :Pack Items;
  :Ship Order;
else (no)
  :Notify Customer;
endif
:Update Inventory;
stop
@enduml
This generates a diagram starting with an initial node, followed by actions like “Receive Order” and a decision node for payment validation. If valid, it proceeds to packing and shipping; otherwise, it notifies the customer. It ends with inventory update and a final node.
Here’s a visual representation of a similar simple activity diagram for payment processing:
This models a CI/CD pipeline with parallel builds, decisions, and partitions for different roles (Developer, Build Server).
PlantUML Code:
@startuml
partition Developer {
  start
  :Push Code;
}
partition "Build Server" {
  :Detect Change;
  fork
    :Build Client;
  fork again
    :Build Server;
  end fork
  if (Build Successful?) then (yes)
    :Deploy Application;
  else (no)
    :Send Failure Email;
  endif
}
stop
@enduml
This includes swimlanes (partitions), a fork for parallel builds, a join implied after the forks, and a decision for deployment. If the build fails, it sends an email instead.
For a visual of a similar deployment or build process:
This demonstrates a review cycle with loops.
PlantUML Code:
@startuml
start
:Create Document;
repeat
  :Review Document;
  :Approve?;
repeat while (No) -> Yes
:Archive Document;
stop
@enduml
It starts with creation, enters a repeat loop for review and approval, and exits to archive once approved.
A comparable diagram for document management:
These examples highlight how PlantUML simplifies diagram creation through code, making it version-controllable and easy to share in documentation.
Activity diagrams play a crucial role in various stages of IT development, enhancing communication, analysis, and design. Here are key applications:
Requirements Analysis: Model business processes to capture user requirements. For instance, diagraming a user registration flow helps identify steps, decisions, and potential errors early.
System Design: Detail the internal workflow of software components, such as API request handling or data processing pipelines. They complement use case diagrams by providing realizations of scenarios.
Business Process Modeling: In agile or waterfall methodologies, use them to map workflows like order fulfillment or ticket resolution in IT service management (e.g., ITIL processes).
Algorithm Visualization: Represent complex algorithms, loops, and conditionals, aiding developers in implementing code logic.
Testing and Validation: Guide test case creation by outlining paths (e.g., happy path vs. error paths), ensuring coverage of all branches.
Integration and Deployment: In DevOps, model CI/CD pipelines, showing parallel tasks like testing and building, to optimize automation scripts.
Documentation and Training: Serve as visual aids in user manuals or onboarding materials, making complex systems accessible to non-technical stakeholders.
By integrating activity diagrams into tools like Jira or Confluence, teams can align development with business goals, reduce misunderstandings, and iterate faster.
Visual Paradigm, a leading UML modeling tool, enhances activity diagram creation through its AI Diagram Generator. This feature uses natural language processing to convert text descriptions into fully editable, standards-compliant UML diagrams, including activity diagrams. Users can input prompts like “Model an online shopping checkout process with payment validation and shipping” to instantly generate diagrams with actions, decisions, forks, and flows.
Key benefits in the IT development process:
Accelerated Creation: AI automates initial diagram generation, reducing manual drawing time from hours to seconds. This is ideal for brainstorming in requirements gathering or rapid prototyping.
Intelligent Layout and Suggestions: The tool ensures clean, balanced layouts with proper spacing and alignment. It infers relationships, fills in missing details, and suggests improvements, such as adding merge nodes for branches.
Full Editability and Integration: Generated diagrams are native to Visual Paradigm, allowing refinements like adding swimlanes or object flows. Integrate with other UML diagrams (e.g., linking to class diagrams) and export to PlantUML or images for sharing.
Collaboration and Iteration: In team settings, AI speeds up reviews by generating variants from updated text prompts. It’s particularly helpful for non-technical users, like business analysts, to contribute without deep UML knowledge.
End-to-End Workflow Support: From analysis reports to validation, AI provides critiques and summaries, ensuring diagrams align with best practices. This streamlines the entire development lifecycle, from design to deployment.
Overall, Visual Paradigm’s AI reduces errors, boosts productivity, and makes UML accessible, transforming how teams handle activity diagrams in IT projects.
Step-by-Step TOGAF ADM Enterprise Architecture Guide: A comprehensive tutorial that explains the Architecture Development Method (ADM) phases and demonstrates how Visual Paradigm helps produce standardized deliverables with instructions, tips, and case studies.
The Ultimate Guide to C4-PlantUML Studio: Revolutionizing Software Architecture Design: This resource explains how the studio combines AI-driven automation, the structural clarity of the C4 model, and the flexibility of PlantUML to solve documentation bottlenecks.
The Essential Guide to ArchiMate: How It Works, Strengths, and Overcoming Challenges with AI: This guide explores how AI-powered ArchiMate diagram generation addresses traditional modeling disadvantages and highlights best practices for effective usage.
Comprehensive Tutorial: Using ArchiMate with TOGAF ADM and the Role of AI in Enterprise Architecture Modeling: A detailed walkthrough exploring how Visual Paradigm, as a certified tool, facilitates EA modeling through its AI Diagram Generator within the TOGAF framework.
Beginner’s Guide to C4 Model Diagrams: A step-by-step introduction to the four levels of abstraction—Context, Containers, Components, and Code—for effective software architecture communication.
Full ArchiMate Viewpoints Guide (Examples Included): A complete reference including 23 official ArchiMate example viewpoints with clear diagram explanations and certified tool vendor insights.
Comprehensive Guide to Applying Gap Analysis in TOGAF ADM: A technical overview providing a systematic approach to identifying discrepancies between current and target architectures within the TOGAF lifecycle.
Comprehensive Tutorial: Generating and Modifying C4 Component Diagrams with AI Chatbot: A hands-on guide demonstrating how to use a conversational AI assistant to create and iteratively refine the internal structures of a software system.
Seamlessly Integrating ArchiMate into TOGAF’s Architecture Development Method: This article explains how to automate the TOGAF ADM process using standard diagrams and a visual Process Navigator to simplify the architect’s journey.
Why ArchiMate? A Guide to the Common Language of Enterprise Architecture: An exploration of ArchiMate’s role as an independent modeling language for describing, analyzing, and visualizing enterprise architectures.
AI-Powered C4 Diagram Generator – Features and Core Levels: Documentation detailing support for the four core C4 levels (Context, Container, Component, Deployment) plus essential supporting architectural views.
TOGAF ADM Phase A: Architecture Vision Deliverables: A focused technical guide detailing the specific activities and mandatory deliverables expected during the initial vision phase of the ADM.
Mastering ArchiMate: A Comprehensive Tutorial for Enterprise Architects: A structured walkthrough designed to help architects use standardized notation to analyze and visualize cross-layer relationships.
Introducing AI-Powered ArchiMate Viewpoints Generator in Visual Paradigm: This release note covers an AI-driven tool that automates the creation of viewpoints to boost modeling speed and standards compliance.
TOGAF ADM: Requirements Management Deliverables: A guide focused on the processes and artifacts required to maintain and manage architectural requirements throughout the entire ADM cycle.