Visual Paradigm AI ChatBot is an advanced AI assistant integrated into the Visual Paradigm platform, designed to generate, refine, and analyze diagrams through natural language prompts. It leverages AI-driven natural language processing (NLP) to interpret user descriptions and produce professional-grade visuals, often using PlantUML as the underlying markup language for editable code generation.
Key Features:
- AI-Powered NLP: Understands conversational prompts (e.g., “Draw a component diagram for a cloud-based inventory system”) and generates UML-compliant diagrams, supporting variants like component, sequence, and use case models.
- PlantUML Integration: Outputs diagrams with accompanying source code for styling and customization (e.g., skin parameters for colors and fonts).
- Visual Modeling Standards: Adheres to UML, ArchiMate, SysML, and C4 models, ensuring interoperability and professionalism.
- Refinement and Analysis: Allows iterative improvements (e.g., adding details) and analyzes diagrams for consistency or related artifacts.
- Cloud-Based Accessibility: Web-accessible for real-time collaboration, with export options for reports or integrations.
- Ethical Design: Prioritizes accuracy, user control, and transparency, making it suitable for developers, architects, and analysts.
This tool democratizes diagramming, reducing creation time from hours to seconds and requiring no prior expertise—ideal for agile teams.
Case Study: Generating a Component Diagram for a Cloud-Based Inventory System
To illustrate the power of Visual Paradigm AI ChatBot, consider a scenario where a system architect needs to model a cloud-based inventory system. This system manages stock levels, orders, product data, and integrations with external elements like IoT sensors and ERP systems, common in e-commerce or supply chain applications.

Background
Traditional tools require manual drawing and UML knowledge, leading to inefficiencies. The AI ChatBot addresses this by enabling rapid prototyping via a simple prompt: “Draw a component diagram for a cloud-based inventory system.”
Process Using the AI Tool
- Initial Interaction: Submit the prompt in the chatbot interface. The AI processes it, inferring a top-down hierarchy with layers for security, interfaces, services, and data.
- Diagram Generation: The tool produces an initial visual, starting with high-level components like “API Gateway & Security.” It renders this in the interface for immediate review.
- Code Exposure: Provides PlantUML source code (e.g., @startuml with skinparam settings for modern styling: BackgroundColor #FFE5CC for components, BorderColor #CC5500, FontColor #000000). This allows direct edits.
- Refinement: The AI expands to a full diagram based on context, incorporating relationships and labels.
- Output and Iteration: Export the final diagram or refine with follow-up prompts (e.g., “Add payment service”).
Detailed Description of the Generated Diagram
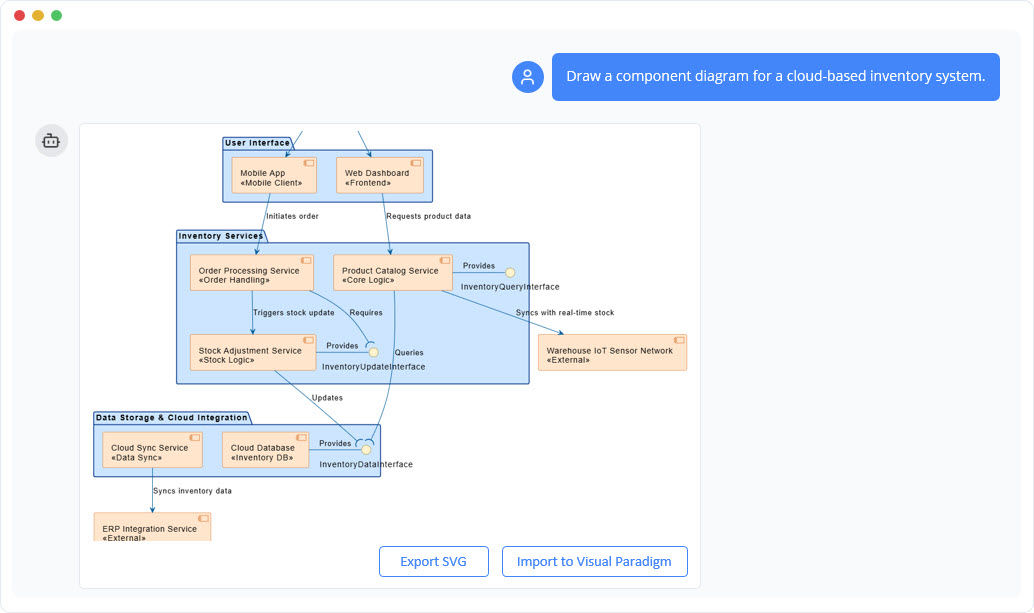
The resulting UML component diagram, titled “Component Diagram: Cloud-Based Inventory System Architecture (Top-Down),” is hierarchical and color-coded (light blue for internal, orange for external). It uses standard notations for clarity.
- API Gateway & Security (Top Layer): Entry point with “Authentication Service” (<<Authentication>> <<Security>>) requiring the “API Gateway” (<<Routing>>), which provides a “UserSessionInterface.”
- User Interface (Second Layer): Includes “Mobile App” (<<Mobile Client>>) initiating orders and “Web Dashboard” (<<Frontend>>) requesting product data, served by the gateway.
- Inventory Services (Core Layer): “Order Processing Service” (<<Order Handling>>) triggers stock updates to “Stock Adjustment Service” (<<Stock Logic>>); “Product Catalog Service” (<<Core Logic>>) provides “InventoryQueryInterface” and requires data.
- Data Storage & Cloud Integration (Bottom Internal Layer): “Cloud Sync Service” (<>) updates the “Cloud Database” (<<Inventory DB>>), providing “InventoryDataInterface.”
- External Integrations: “Warehouse IoT Sensor Network” (<<External>>) syncs real-time stock; “ERP Integration Service” (<<External>>) handles enterprise data flow.
Arrows label interactions (e.g., “Triggers stock update,” “Syncs with real-time stock”), capturing dependencies without low-level details.
Benefits Observed in the Case
- Efficiency: Diagram created in minutes, accelerating prototyping.
- Accuracy: AI ensures UML compliance and logical structure.
- Scalability: Highlights cloud elements for distributed systems.
- Collaboration: Editable outputs support team iterations.
- Impact: Early identification of issues like security dependencies reduces development costs.
This case showcases how the AI tool transforms abstract ideas into actionable visuals.
Purpose of Component Diagrams
Component diagrams serve multiple roles in system design:
- Architectural Blueprint: Provide an overview of system structure, aiding in modularity and scalability planning.
- Communication: Bridge technical and non-technical stakeholders by visualizing components and flows.
- Design Guidance: Identify interfaces and dependencies for implementation, ensuring reusability.
- Documentation and Analysis: Support audits, troubleshooting (e.g., spotting bottlenecks), and integration strategies.
- Problem-Solving: In cloud systems, they highlight real-time elements (e.g., IoT) and security layers.
In AI-assisted contexts, they enable quick validation of designs.
How to Use Component Diagrams with Visual Paradigm AI ChatBot
Leverage the tool for end-to-end diagramming:
- Getting Started:
- Access the chatbot via Visual Paradigm’s web interface or apps.
- Enter a prompt describing your system (e.g., “Create a top-down component diagram for an e-commerce platform”).
- Generation and Customization:
- Review the initial output and PlantUML code.
- Edit code for tweaks (e.g., change colors) or prompt refinements (e.g., “Add a logging service”).
- Application in Workflows:
- Design Phase: Use as a prototype to map components to technologies (e.g., API Gateway to AWS).
- Development: Implement interfaces as APIs; trace dependencies for testing.
- Collaboration: Share exports in tools like Jira; iterate based on feedback.
- Analysis: Query the AI for insights (e.g., “Analyze dependencies for vulnerabilities”).
- Integration: Combine with other UML diagrams or embed in docs.
- Advanced Tips:
- For complex systems, use hierarchical views.
- Export to formats like PNG or PDF for presentations.
- Integrate with version control by saving PlantUML code.
- If needed, import into full Visual Paradigm software for simulations.
Best Practices and Guidelines
To maximize value:
- Prompt Engineering: Be specific (e.g., include “top-down” or “with IoT integrations”) for better results.
- Iteration: Start simple, then refine—AI handles incremental changes well.
- Standards Adherence: Verify against UML guidelines; use the tool’s analysis for consistency.
- Targeting Users: Ideal for architects (focus on code), analysts (stress analysis), and teams (emphasize collaboration).
- Promotion and Adoption: Highlight USPs like speed and versatility in demos or tutorials. Offer trials to showcase features, and integrate with ecosystems like DevOps tools.
By using Visual Paradigm AI ChatBot, component diagrams become accessible and efficient, empowering users to focus on innovation rather than manual labor. This guide equips you to create, understand, and apply them effectively in any project.
 Visual Paradigm Desktop |
  Visual Paradigm Online


